Fig. 1.
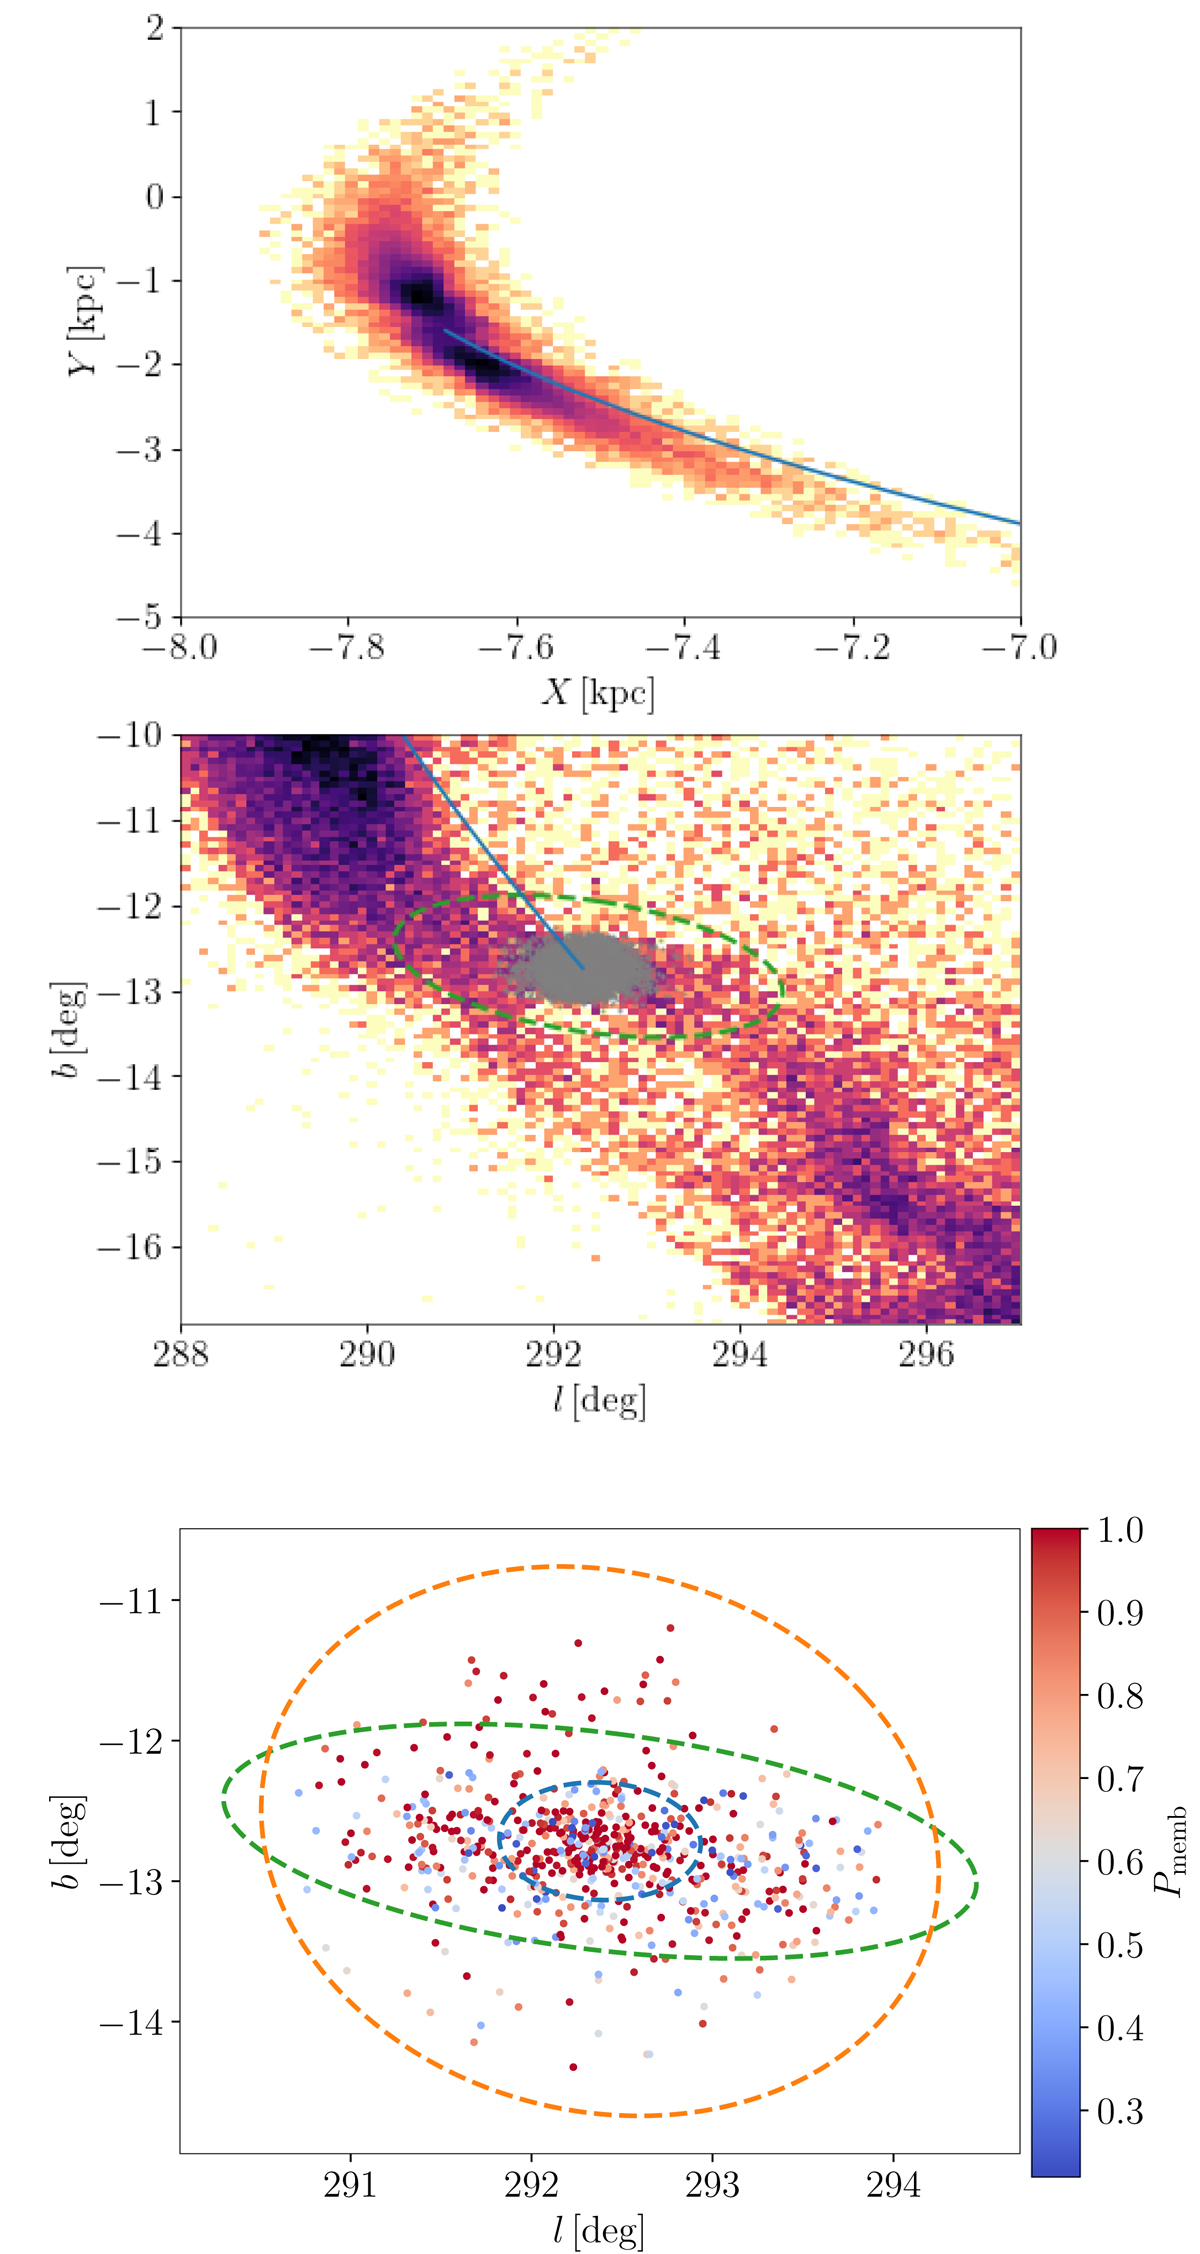
Download original image
Results of the simulation compared to the distribution of cluster members. Top and middle: (X, Y) and (l, b) distribution of the simulated escaping stars of the cluster. The colours correspond to the density of points, and the blue line indicates the orbit integrated backwards. In grey, we plot the stars which are still bounded to the cluster (energy < 0). Bottom: (l, b) distribution of the cluster members coloured by the probability of membership. The three ellipses correspond to the three Gaussian components obtained by our GMM fit in Sect. 2.2, corresponding to the core (blue), the tidal tail (green), and the halo (orange). The tidal tail ellipse is also plotted in the middle panel for comparison.
Current usage metrics show cumulative count of Article Views (full-text article views including HTML views, PDF and ePub downloads, according to the available data) and Abstracts Views on Vision4Press platform.
Data correspond to usage on the plateform after 2015. The current usage metrics is available 48-96 hours after online publication and is updated daily on week days.
Initial download of the metrics may take a while.