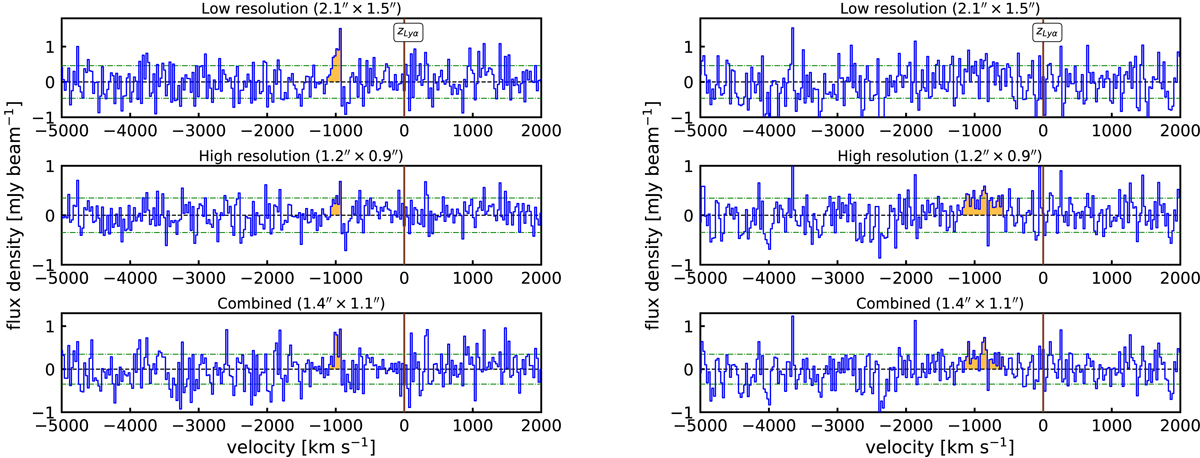
Fig. B.1.
Download original image
Left: NOEMA spectrum of GN-108036 with a possible new [C II] 158 μm transition detection (orange area). In all three panels, the green dotted line indicates the respective rms noise for three different data sets. Red solid line indicates the redshift measured by Lyα detection. Right: Same as the left panel but for the companion system.
Current usage metrics show cumulative count of Article Views (full-text article views including HTML views, PDF and ePub downloads, according to the available data) and Abstracts Views on Vision4Press platform.
Data correspond to usage on the plateform after 2015. The current usage metrics is available 48-96 hours after online publication and is updated daily on week days.
Initial download of the metrics may take a while.