Fig. 1.
Download original image
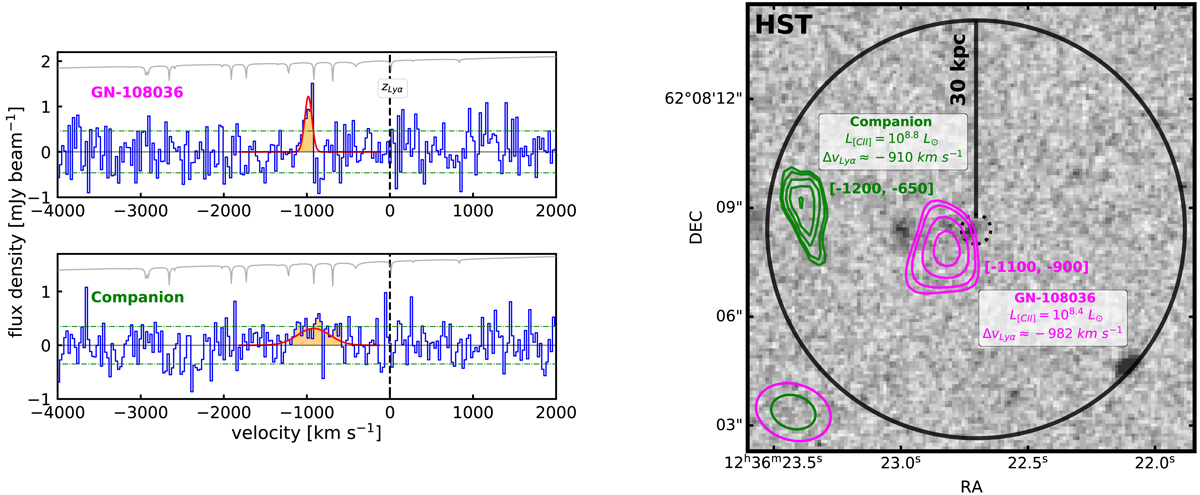
Left: [C II] line spectrum of GN-108036 (top) and a potential companion located ∼30 kpc east (bottom). The zero velocity is set using the redshift from the detection of the Lyα line (black dashed vertical line Ono et al. 2012). The best 1D Gaussian fits to the tentative detections are shown in red. The spectrum of GN-108036 and the potential companion are extracted from the compact and extended array configuration data, respectively. Right: HST rest-frame UV map of the field of GN-108036. The black dotted circle indicates the position of the HST rest-frame UV emission from GN-108036, and the black solid circle around the center has a radius of 30 kpc. The integrated intensity contours of the [C II] line emission in GN-108036 (2.5, 3, 4 and 5σ levels) extracted from the compact array data are shown in magenta. In green we show the potential detection of a companion based on the [C II] line emission extracted from the extended array data. The beam sizes are shown in the lower left corner. The atmospheric transmission curve in the frequency range covered by our observations is shown as a gray line on the top part of the panels.
Current usage metrics show cumulative count of Article Views (full-text article views including HTML views, PDF and ePub downloads, according to the available data) and Abstracts Views on Vision4Press platform.
Data correspond to usage on the plateform after 2015. The current usage metrics is available 48-96 hours after online publication and is updated daily on week days.
Initial download of the metrics may take a while.