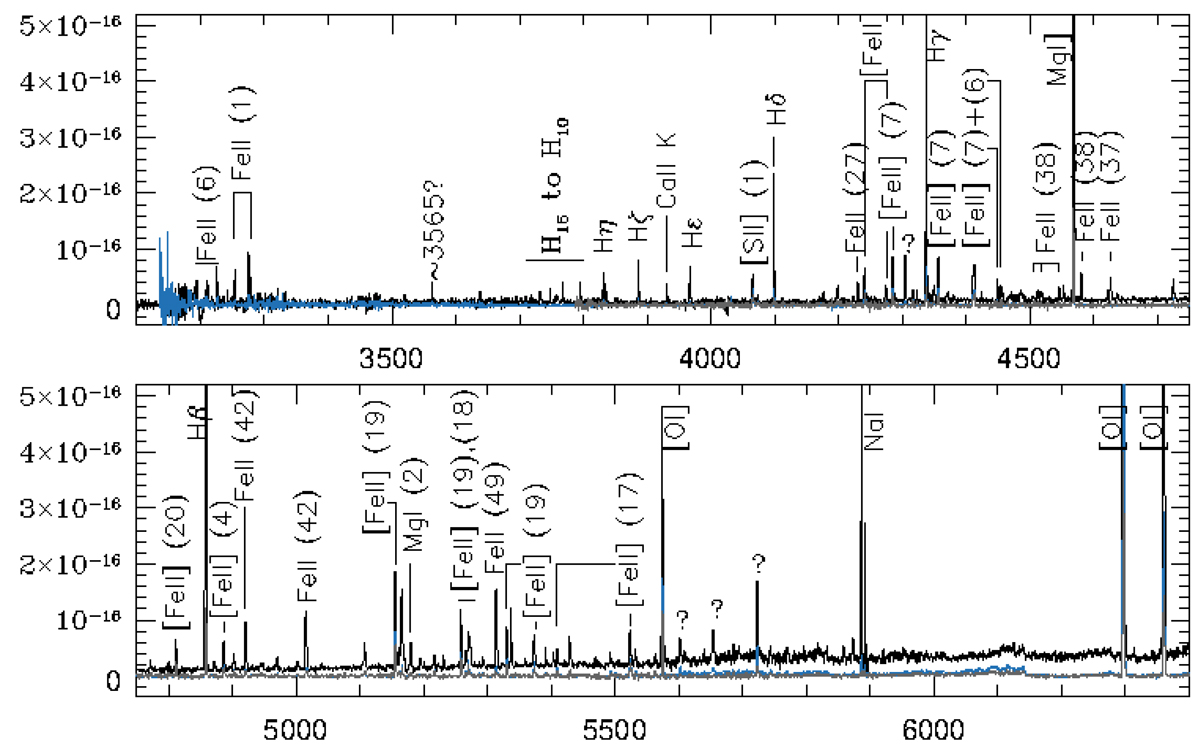
Fig. 9.
Download original image
U to V band of the X-shooter spectra. Black, light blue, and gray lines are for epochs 7, 8, and 9, respectively. Y-axis units are erg cm−2 s−1 Å−1; X axis units are Å. The epoch 9 spectrum was cut below ∼3800 Å, because no signal was evident there in the 2D frame. The epoch 8 and 9 spectra are almost identical in the continuum (where present), with the epoch 9 spectrum having stronger molecular bands in emission. Bracketed numbers refer to the Moore’s multiplet identification (Moore 1945).
Current usage metrics show cumulative count of Article Views (full-text article views including HTML views, PDF and ePub downloads, according to the available data) and Abstracts Views on Vision4Press platform.
Data correspond to usage on the plateform after 2015. The current usage metrics is available 48-96 hours after online publication and is updated daily on week days.
Initial download of the metrics may take a while.