Fig. 6.
Download original image
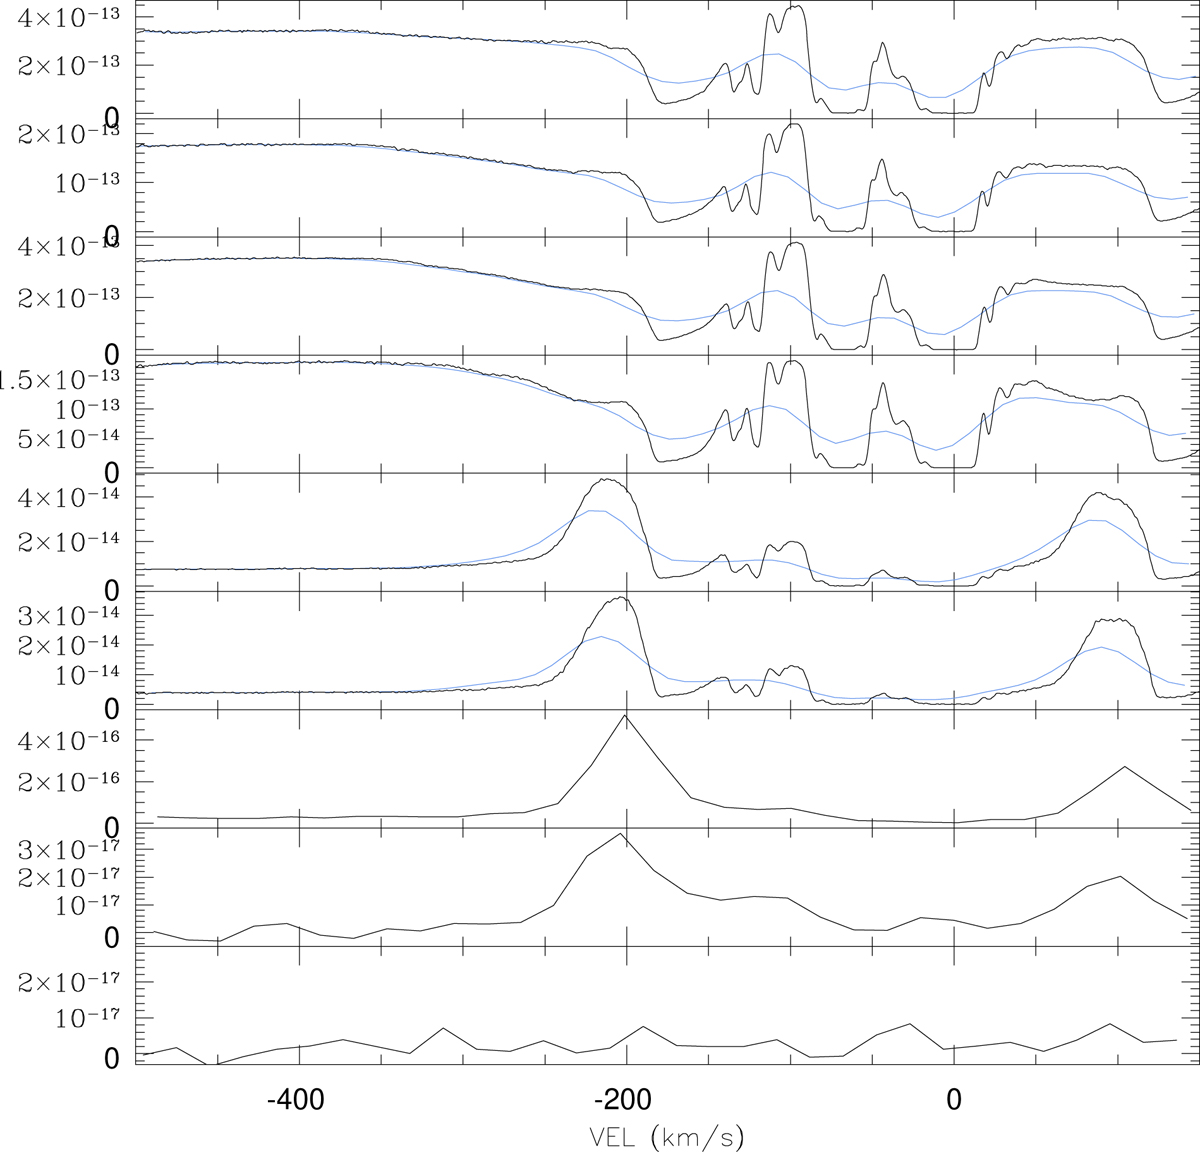
Na I D emission lines evolution across time (time increase from top to bottom). Black color indicates the original spectra (UVES or X-shooter), while the light blue is for the UVES spectra degraded to the X-shooter resolution. Comparing epochs 5 and 6 (UVES) with epochs 7 and 8, it is evident that what appears as a “red wing plateau” in the low-resolution spectra could well be a signature of the non-resolved persistent absorption. Velocities are in the heliocentric rest frame. Y-axis units are erg cm−2 s−1 Å−1.
Current usage metrics show cumulative count of Article Views (full-text article views including HTML views, PDF and ePub downloads, according to the available data) and Abstracts Views on Vision4Press platform.
Data correspond to usage on the plateform after 2015. The current usage metrics is available 48-96 hours after online publication and is updated daily on week days.
Initial download of the metrics may take a while.