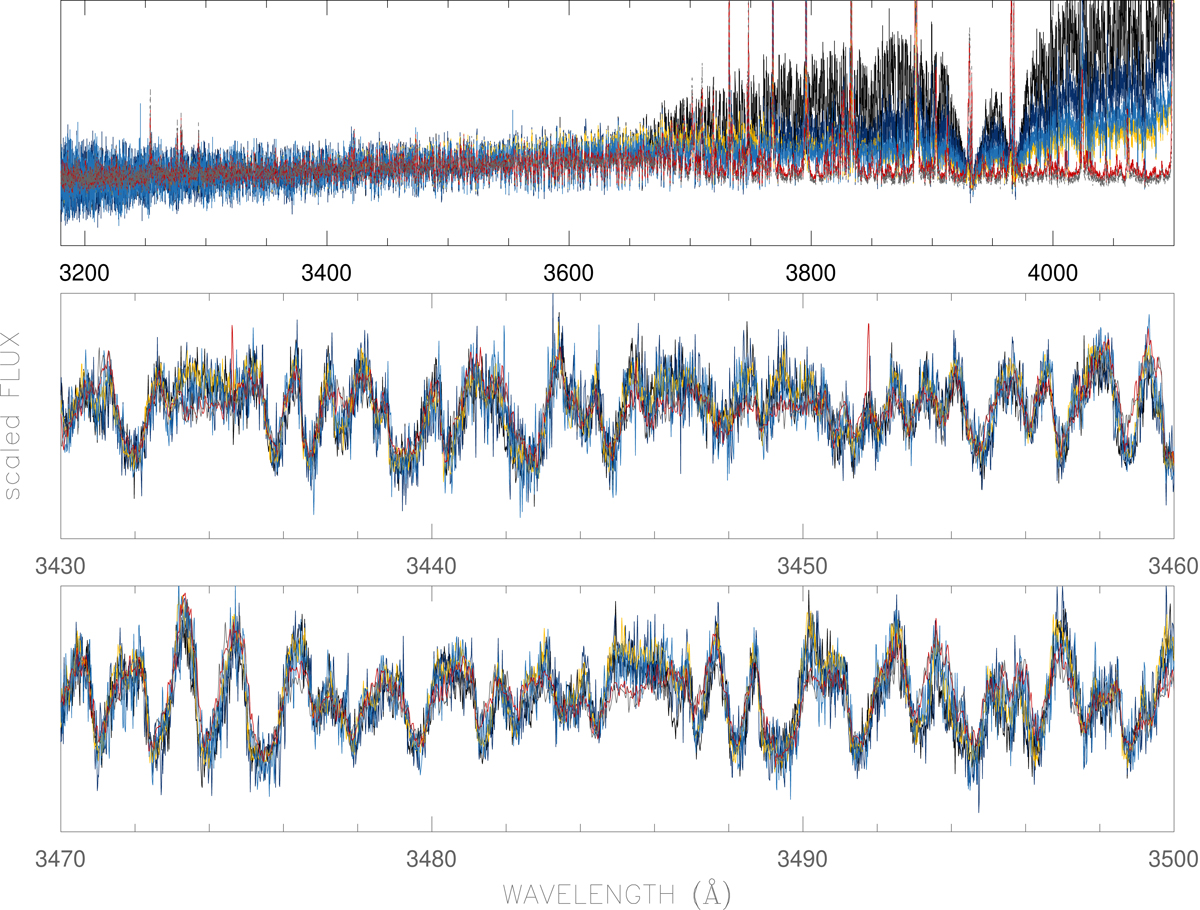
Fig. 4.
Download original image
Selected ranges in the U-band spectrum displaying the “curtain”. This is mostly produced by ground transitions from neutral and singly ionized metals and completely absorbing the continuum blue-ward of the Balmer jump. The top panel shows the whole wavelength range 3200–4100 Å; the middle and the bottom panels show zoomed in portions of the curtain. Black, blue, yellow, light-blue, red and dotted-gray are for epochs 1, 2, 3, 4, 5, and 6, respectively.
Current usage metrics show cumulative count of Article Views (full-text article views including HTML views, PDF and ePub downloads, according to the available data) and Abstracts Views on Vision4Press platform.
Data correspond to usage on the plateform after 2015. The current usage metrics is available 48-96 hours after online publication and is updated daily on week days.
Initial download of the metrics may take a while.