Fig. 7
Download original image
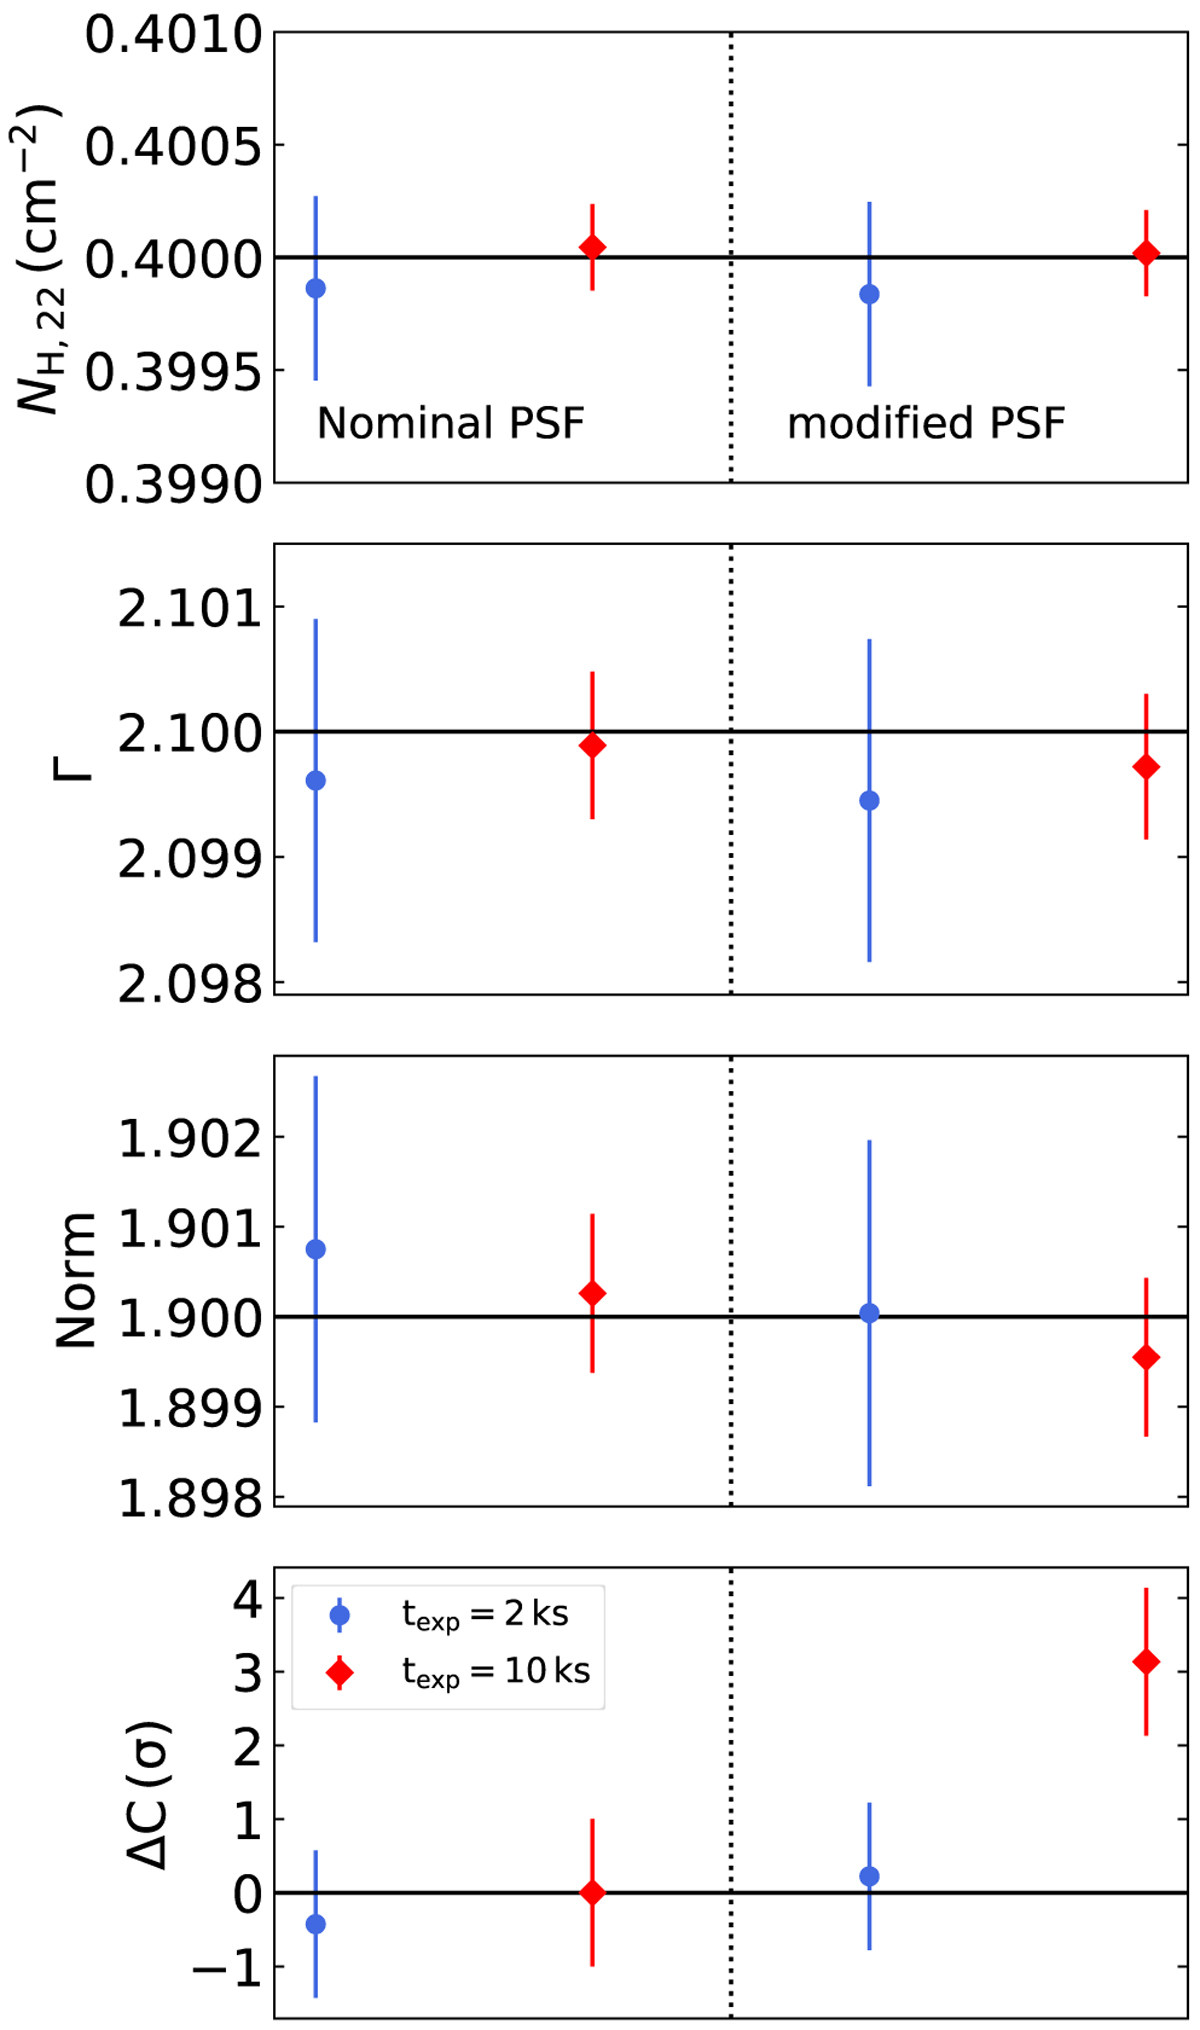
Best-fit parameters obtained by fitting simultaneously all the event grades for a flux level of 200 mCrab using the nominal PSF (left) and the modified PSF (right, as explained in Sect. 4.2), for texp = 2 ks and 10 ks (blue circles and red diamonds, respectively). The error bars correspond to the 90% confidence level. Bottom panel: deviation of the best-fit C-stat from the expected value estimated by following the analytic prescription presented by Kaastra (2017).
Current usage metrics show cumulative count of Article Views (full-text article views including HTML views, PDF and ePub downloads, according to the available data) and Abstracts Views on Vision4Press platform.
Data correspond to usage on the plateform after 2015. The current usage metrics is available 48-96 hours after online publication and is updated daily on week days.
Initial download of the metrics may take a while.