Fig. 4
Download original image
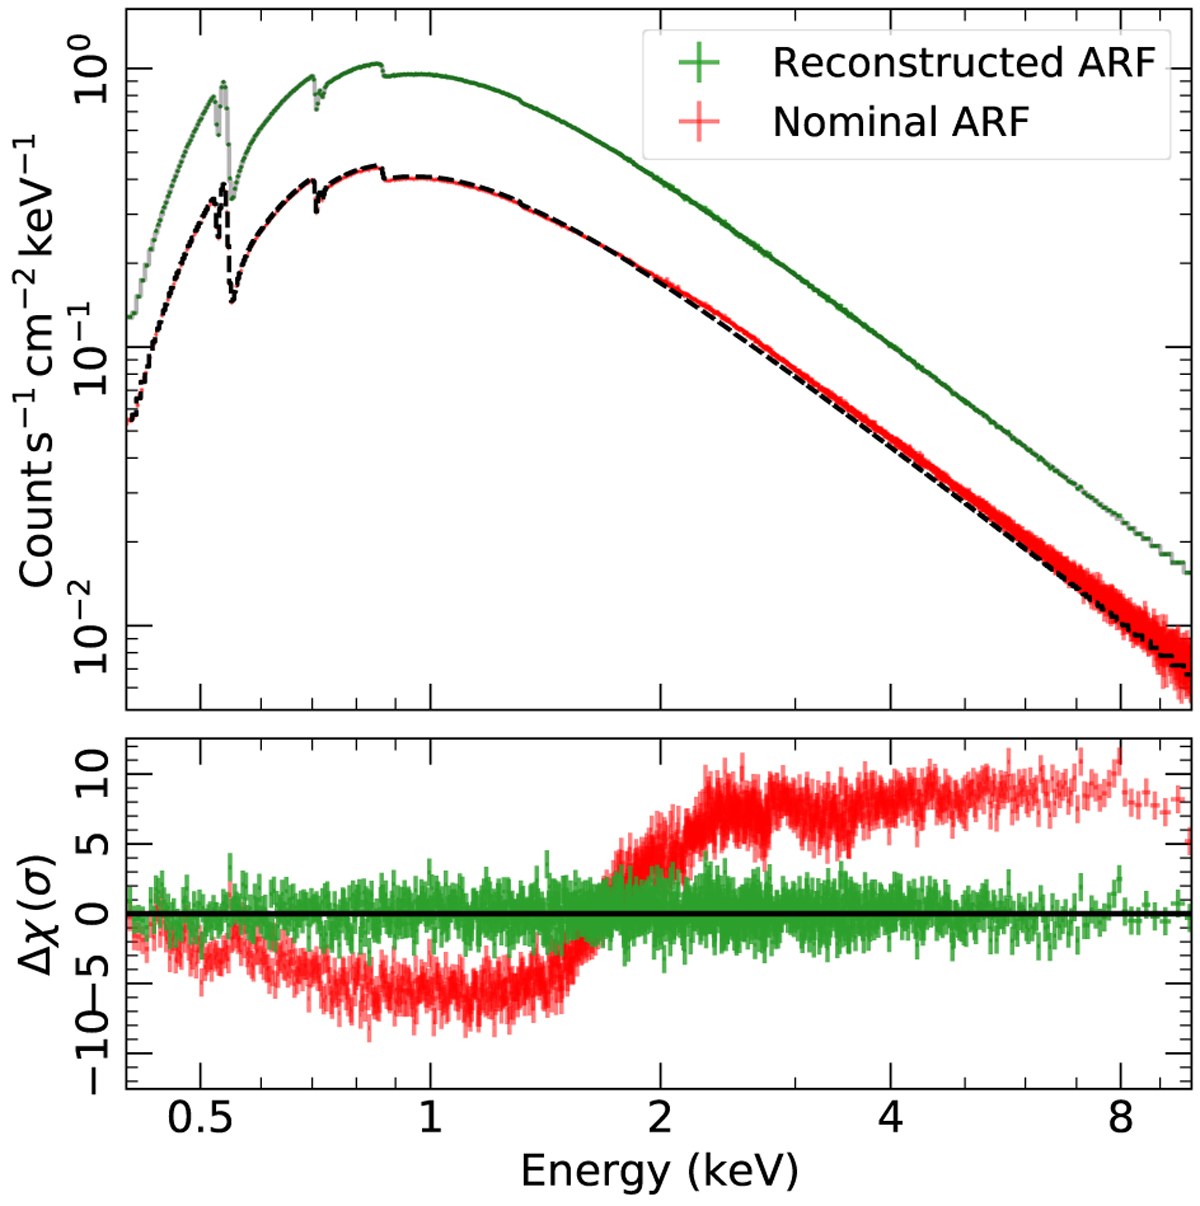
Simulated MR spectrum assuming a flux level of 200 mCrab (with an exposure of 10 ks), using the nominal ARF (i.e. without applying any reconstruction) in red and the reconstructed ARF in green. The black dashed line corresponds to the model obtained by fitting the spectrum using the nominal ARF, fixing NH and Γ to the input values, leaving only the normalization free. The corresponding residuals are shown in the bottom panel (red points). In the case of the reconstructed ARF, the residuals are shown using the input parameters from the simulations, without performing any fit. The spectra are rebinned for clarity reasons.
Current usage metrics show cumulative count of Article Views (full-text article views including HTML views, PDF and ePub downloads, according to the available data) and Abstracts Views on Vision4Press platform.
Data correspond to usage on the plateform after 2015. The current usage metrics is available 48-96 hours after online publication and is updated daily on week days.
Initial download of the metrics may take a while.