Fig. A.1
Download original image
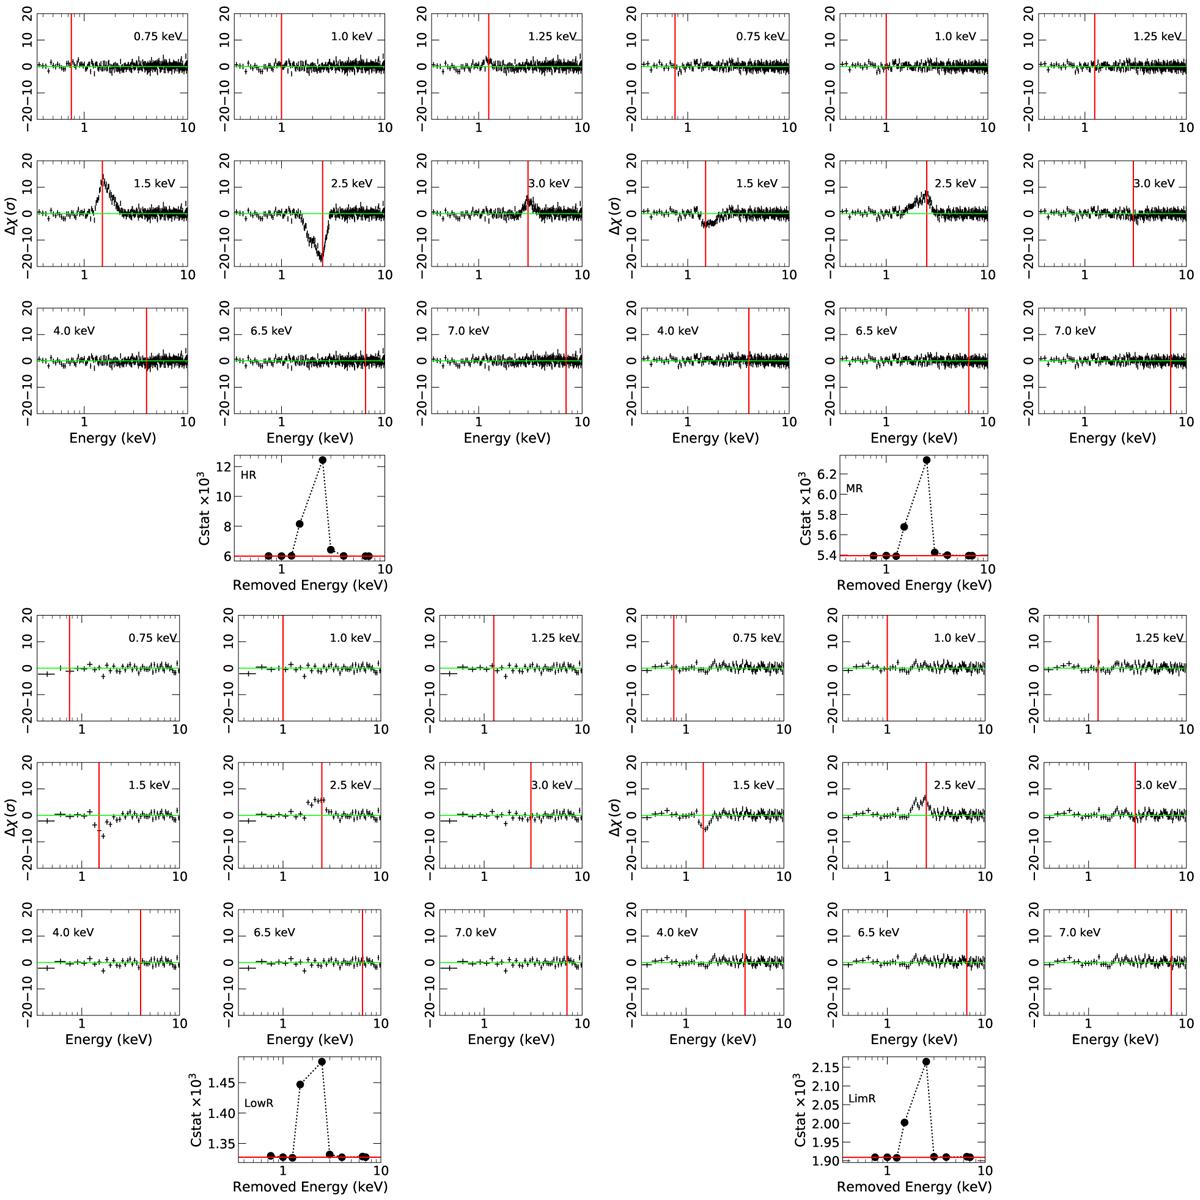
Residuals -for the different grades, assuming that the PSF is not known at a given energy (indicated by a vertical solid line) during the interpolation. The bottom panel shows how the C-stat changes as a function of the removed energy. The horizontal line in this panel corresponds to the C-stat value obtained by fitting the spectrum using all energies to reconstruct the ARF.
Current usage metrics show cumulative count of Article Views (full-text article views including HTML views, PDF and ePub downloads, according to the available data) and Abstracts Views on Vision4Press platform.
Data correspond to usage on the plateform after 2015. The current usage metrics is available 48-96 hours after online publication and is updated daily on week days.
Initial download of the metrics may take a while.