Fig. 11
Download original image
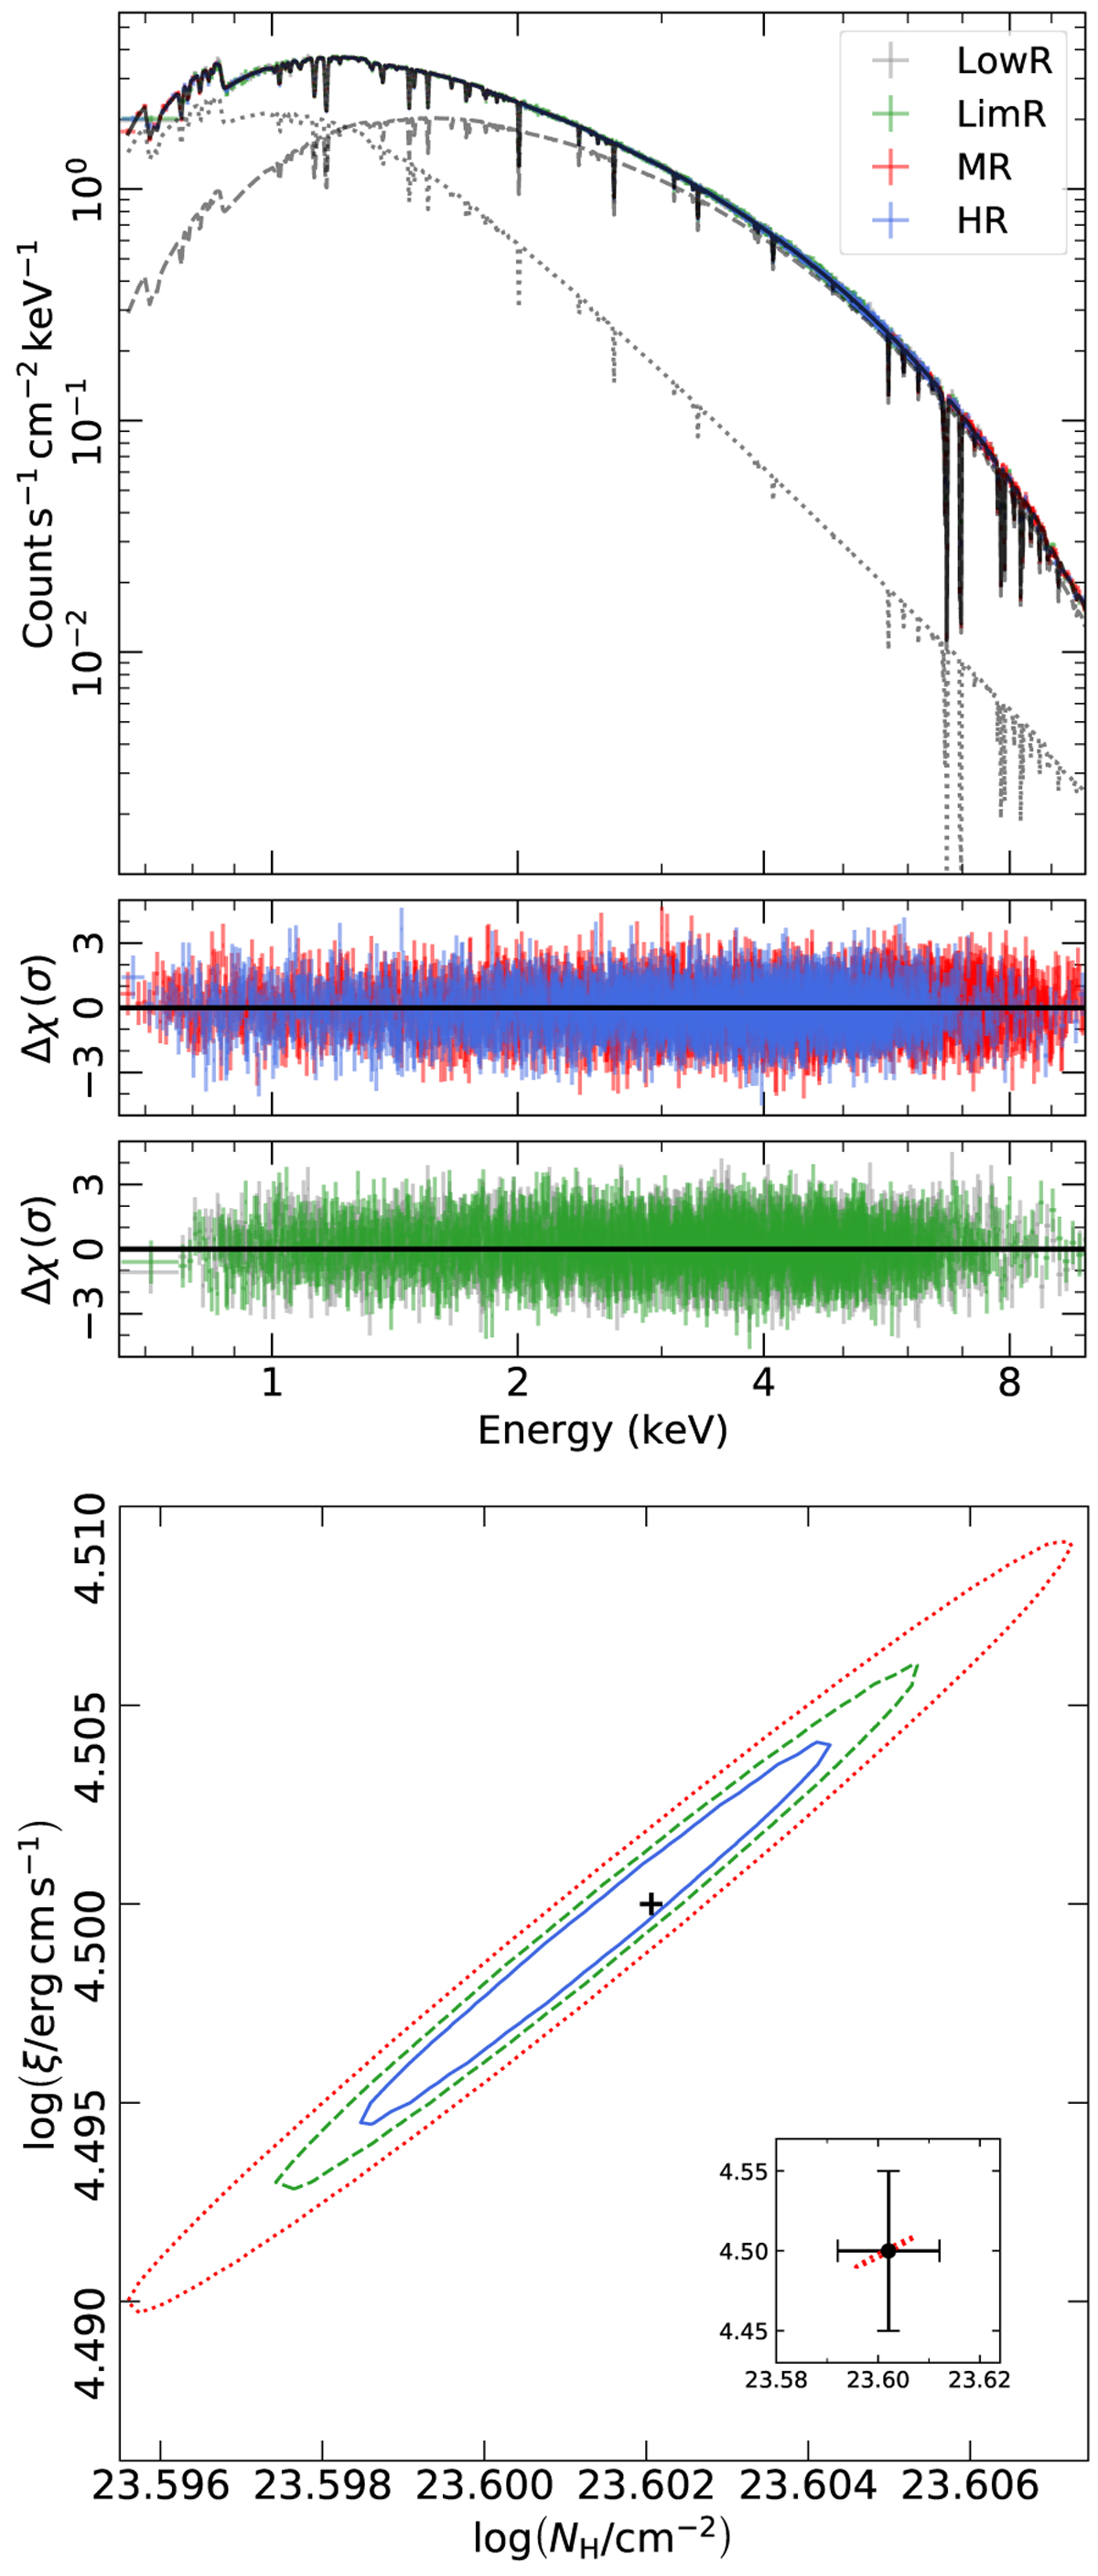
Reconstructed simulated spectra of GRO J1655-40 for texp = 10 ks at a flux level of 1 Crab (top panel). The dotted and dashed lines represent the black-body and the power-law components, respectively. The spectra are rebinned for clarity reasons. Bottom panel: log ξ vs. log NH confidence contours at the 1, 2, and 3σ levels. The black cross shows the input values used for the simulations. The inset shows the typical precision (at lσ) that can be achieved using current facilities. We plot the 3σ contours obtained with the X-IFU, for comparison.
Current usage metrics show cumulative count of Article Views (full-text article views including HTML views, PDF and ePub downloads, according to the available data) and Abstracts Views on Vision4Press platform.
Data correspond to usage on the plateform after 2015. The current usage metrics is available 48-96 hours after online publication and is updated daily on week days.
Initial download of the metrics may take a while.