Open Access
Fig. 10
Download original image
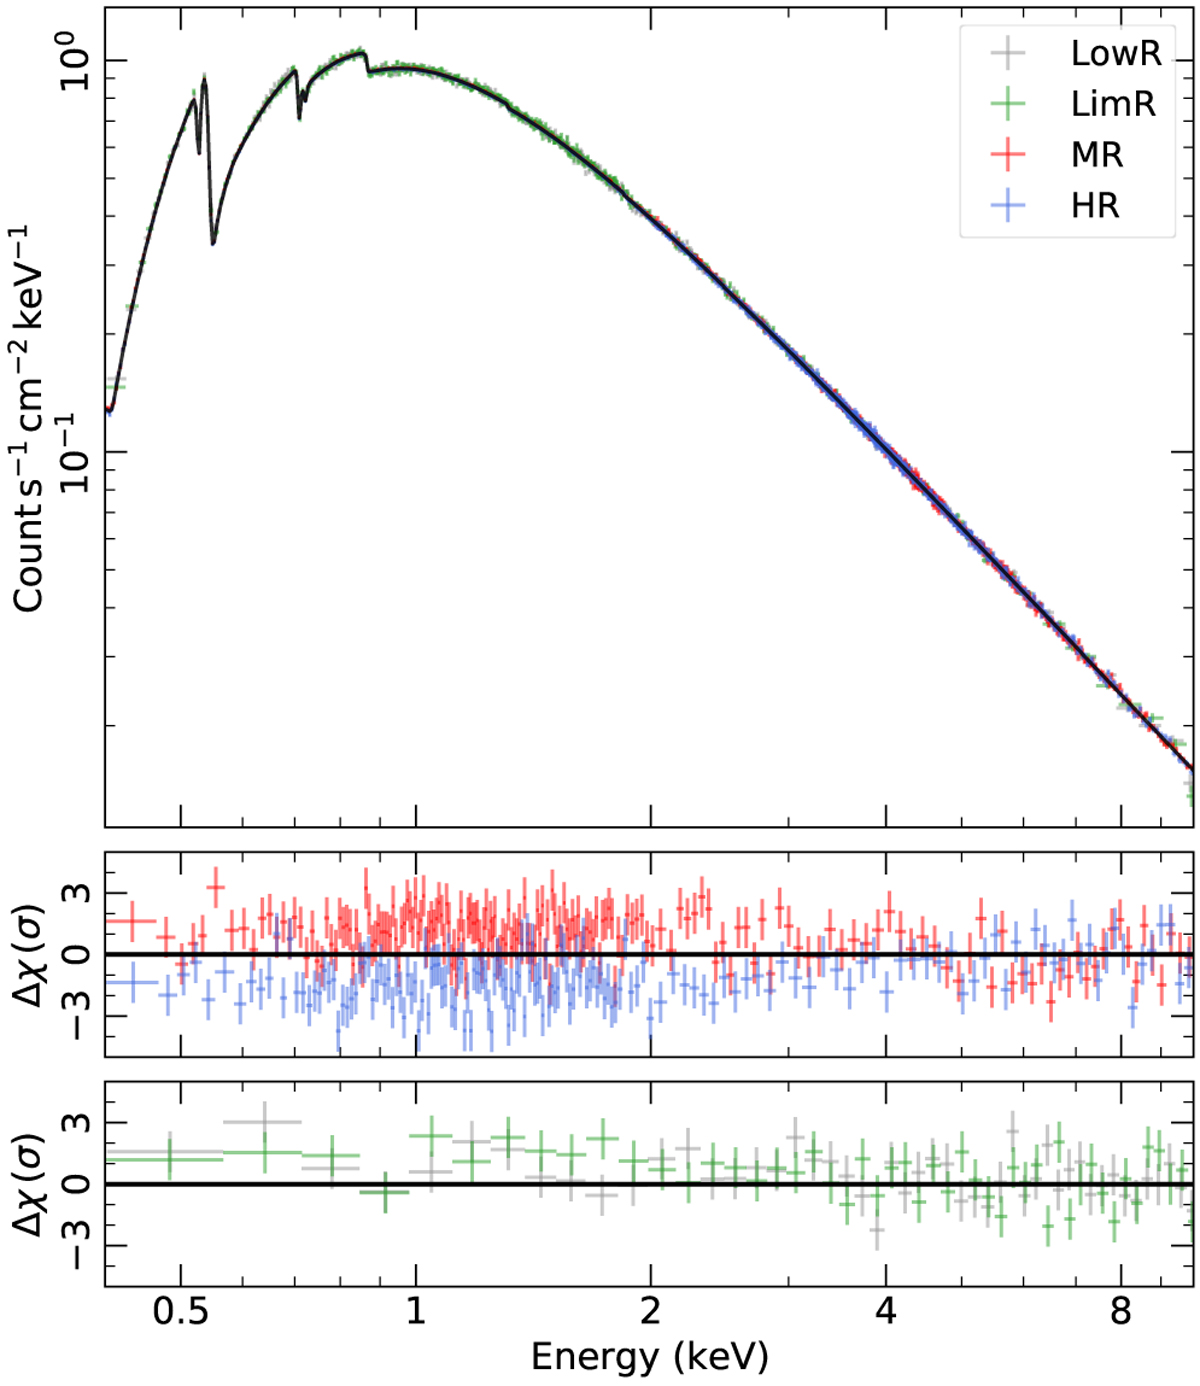
Reconstructed simulated spectra (normalized by the effective area) assuming a flux level of 200 mCrab and an exposure of 10 ks, for the different event grades, using the modified PSF as explained in Sect. 4.2. Bottom panels: residuals for each event grade. All the spectra are rebinned for clarity reasons.
Current usage metrics show cumulative count of Article Views (full-text article views including HTML views, PDF and ePub downloads, according to the available data) and Abstracts Views on Vision4Press platform.
Data correspond to usage on the plateform after 2015. The current usage metrics is available 48-96 hours after online publication and is updated daily on week days.
Initial download of the metrics may take a while.