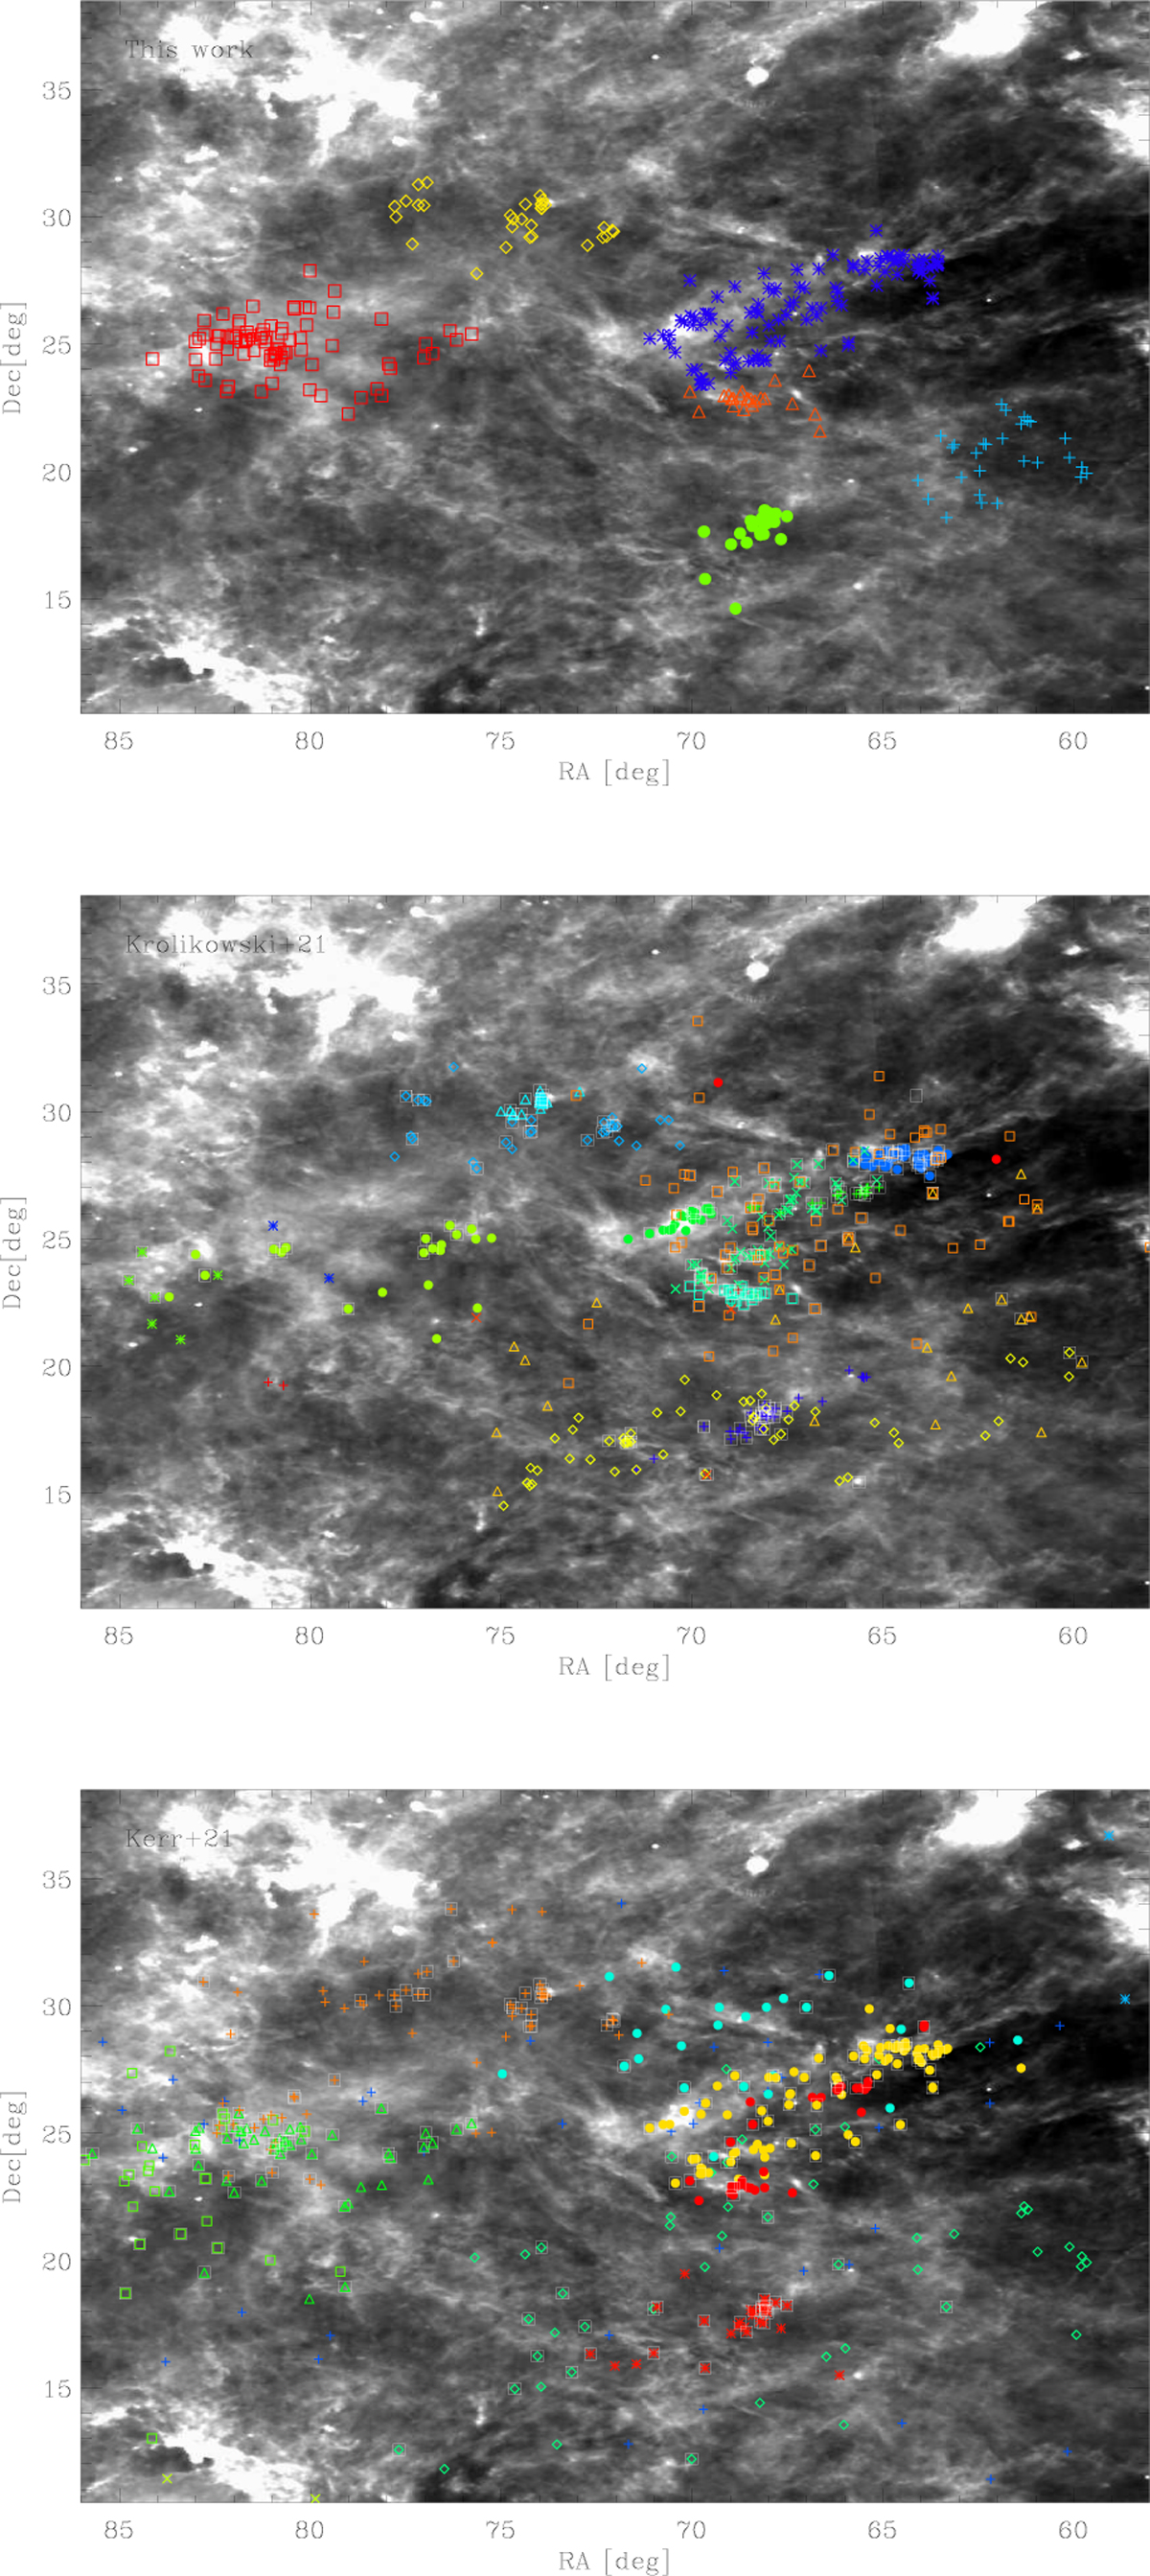
Fig. C.1
Download original image
YSOs associated with Taurus-Auriga selected in this work (upper panel), Krolikowski et al. (2021; middle panel), and Kerr et al. (2021; lower panel). Colours and symbols indicate the sub-structures we found with DBSCAN. those derived by the Gaussian mixture model (GMM) in Krolikowski et al. (2021), and those derived as EOM by Kerr et al. (2021). White boxes in the middle and lower panels indicate the YSOs in common with our catalogue. YSOs are overplotted on an IRIS 100 µm image (Miville-Deschênes & Lagache 2005).
Current usage metrics show cumulative count of Article Views (full-text article views including HTML views, PDF and ePub downloads, according to the available data) and Abstracts Views on Vision4Press platform.
Data correspond to usage on the plateform after 2015. The current usage metrics is available 48-96 hours after online publication and is updated daily on week days.
Initial download of the metrics may take a while.