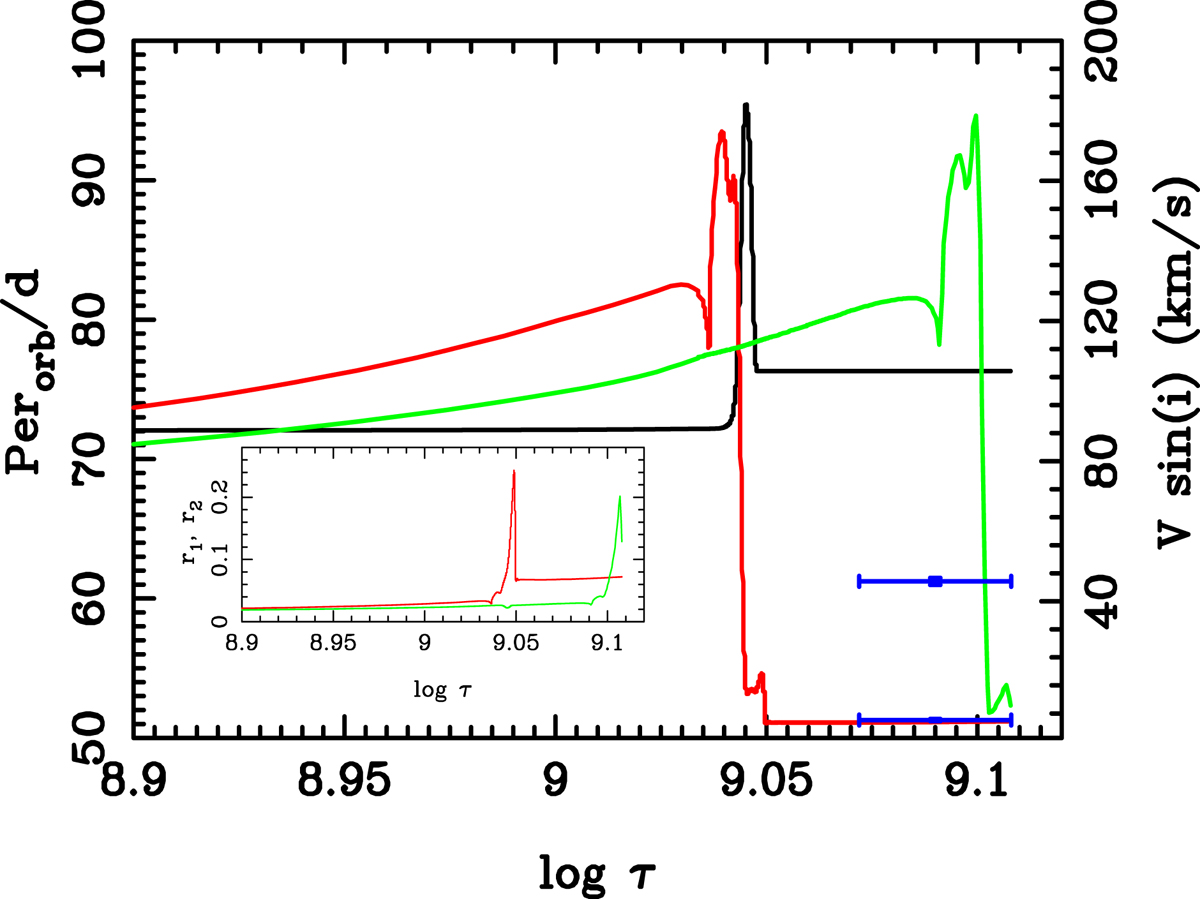
Fig. 16.
Download original image
Rotational velocities, according to the integrations of Eqs. (1)–(4), as a function of time for the rotating models shown in Fig. 12. Continuous red line represents the primary and the green one denotes the secondary. The two blue lines indicate the error bars for the mean age of the system. Lower-left corner illustrates the variations in the relative radii of the primary and secondary. Same initial conditions as in Fig. 13.
Current usage metrics show cumulative count of Article Views (full-text article views including HTML views, PDF and ePub downloads, according to the available data) and Abstracts Views on Vision4Press platform.
Data correspond to usage on the plateform after 2015. The current usage metrics is available 48-96 hours after online publication and is updated daily on week days.
Initial download of the metrics may take a while.