Fig. A.1
Download original image
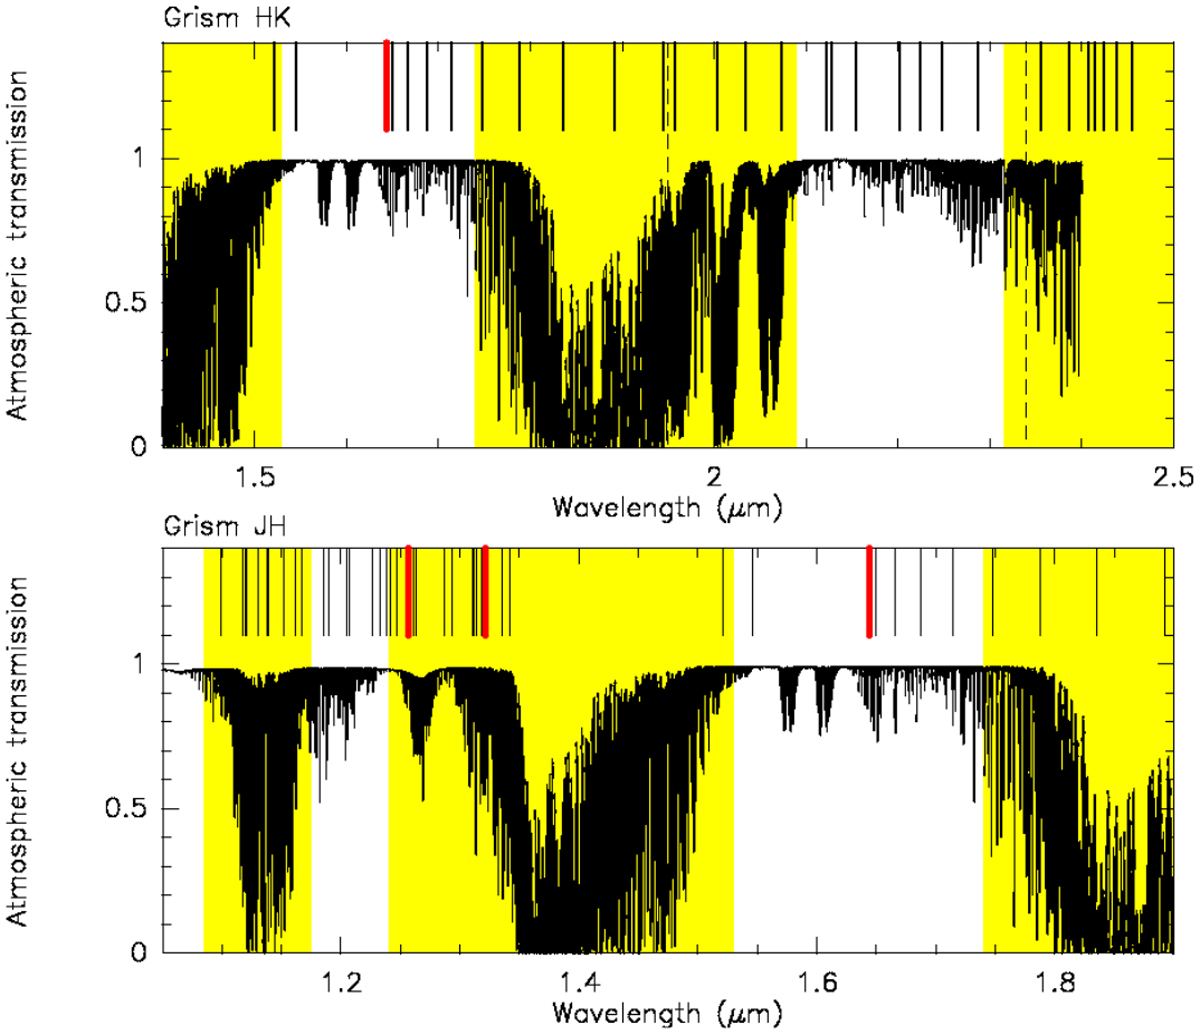
Atmospheric transmission in the bands spanned by grism HK (top panel) and JH (bottom panel). The vertical bars indicate the wavelengths of the H2 lines (black) and [Fe ii] lines (red) discussed in the main text. The yellow areas mark the wavelength ranges within which correction for atmospheric extinction may exhibit large errors. The range spanned by grism KB is limited by the vertical dashed lines.
Current usage metrics show cumulative count of Article Views (full-text article views including HTML views, PDF and ePub downloads, according to the available data) and Abstracts Views on Vision4Press platform.
Data correspond to usage on the plateform after 2015. The current usage metrics is available 48-96 hours after online publication and is updated daily on week days.
Initial download of the metrics may take a while.