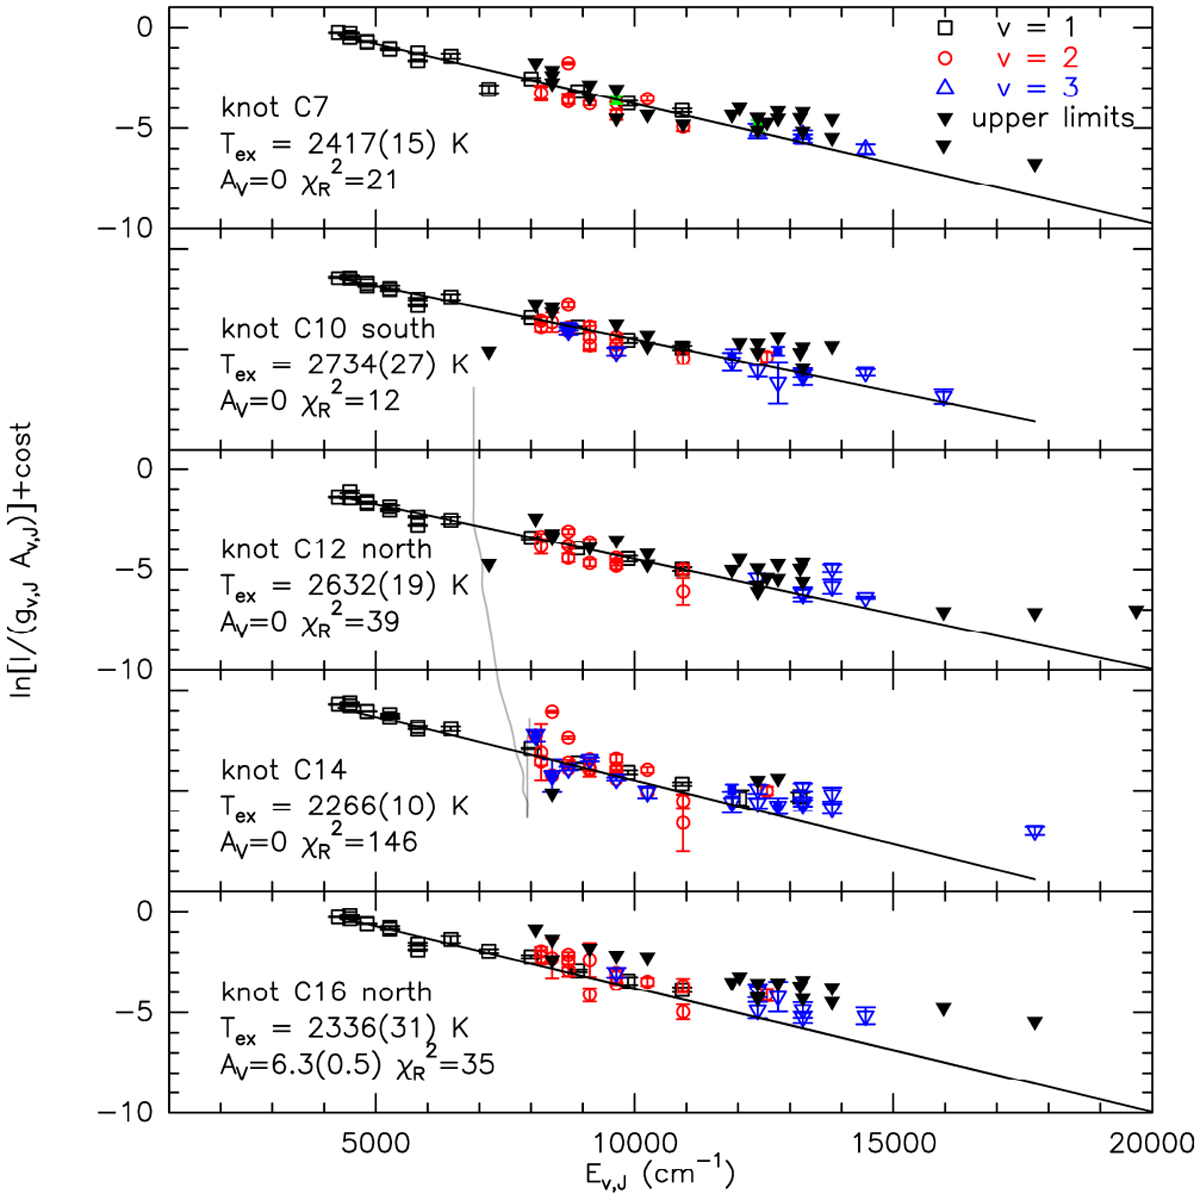
Fig. 5
Download original image
Ro-vibrational plots (Boltzmann plots) of the H2 lines from knots C1–17, with full JHK coverage. Open black squares mark transitions from the upper vibrational level v = 1, open red circles transitions from v = 2, open blue triangles transitions from v = 3, and full black triangles upper limits for various undetected transitions. The straight lines mark the best linear fits obtained for both the excitation temperature and the extinction simultaneously. The data displayed have been corrected for the extinction value providing the best fit. The obtained temperature, extinction, and reduced χ2 are also indicated in each panel.
Current usage metrics show cumulative count of Article Views (full-text article views including HTML views, PDF and ePub downloads, according to the available data) and Abstracts Views on Vision4Press platform.
Data correspond to usage on the plateform after 2015. The current usage metrics is available 48-96 hours after online publication and is updated daily on week days.
Initial download of the metrics may take a while.