Open Access
Fig. 4
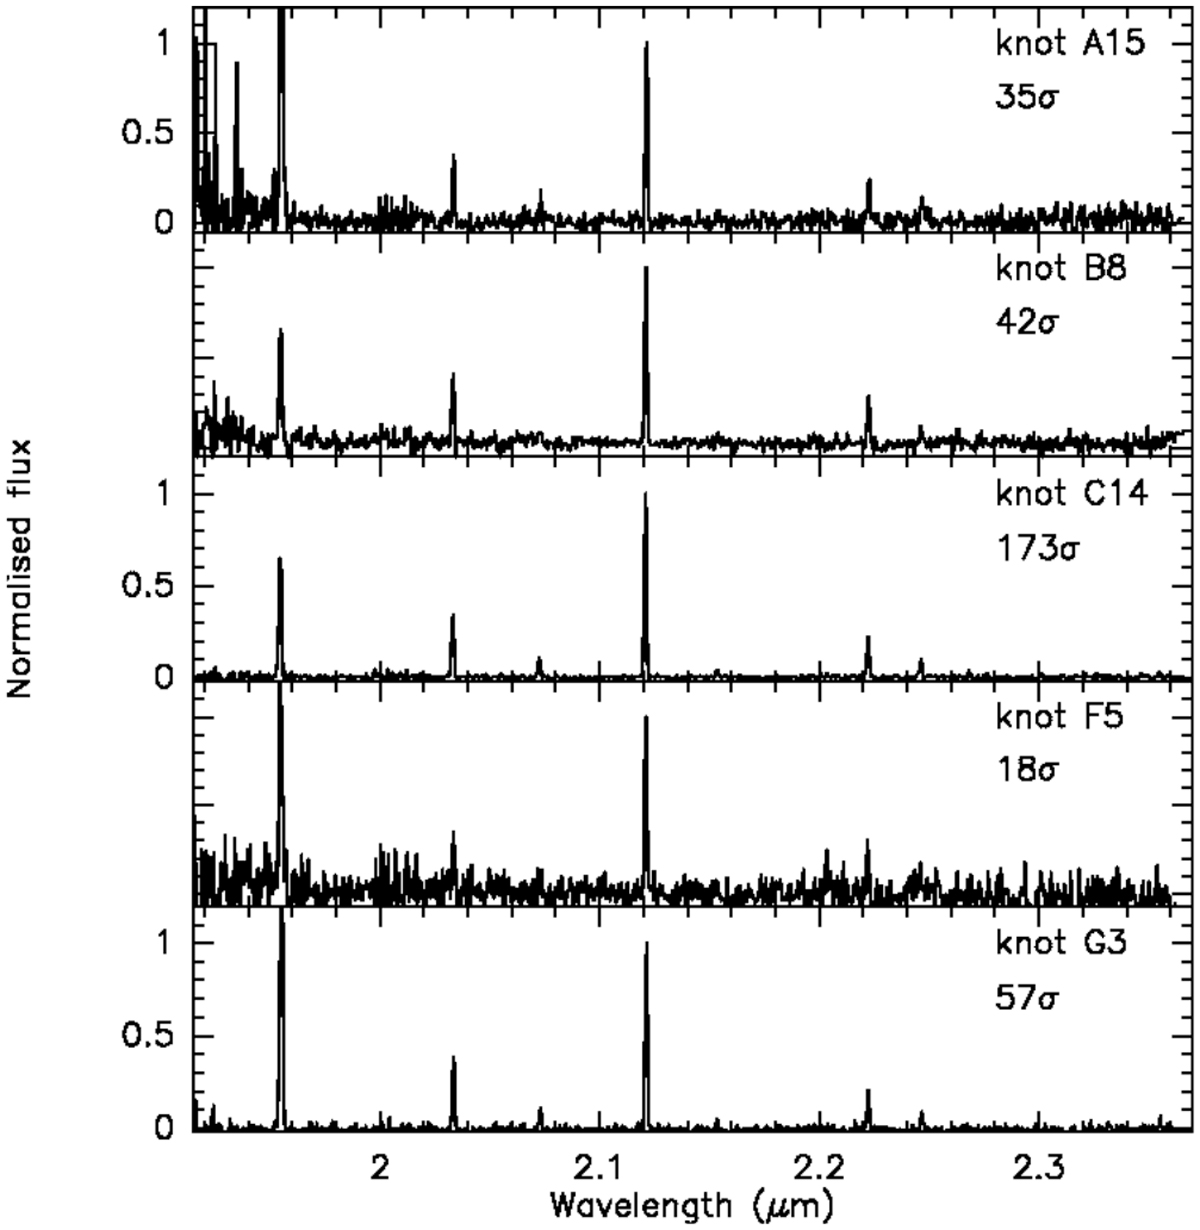
Download original image
Comparison of the KB spectra of knots A15, B8, C14, F5, and G3. The ratio of the H2 1–0 S(1) peak flux density and the r.m.s. in the adjacent spectral regions is indicated in each panel.
Current usage metrics show cumulative count of Article Views (full-text article views including HTML views, PDF and ePub downloads, according to the available data) and Abstracts Views on Vision4Press platform.
Data correspond to usage on the plateform after 2015. The current usage metrics is available 48-96 hours after online publication and is updated daily on week days.
Initial download of the metrics may take a while.