Fig. 3
Download original image
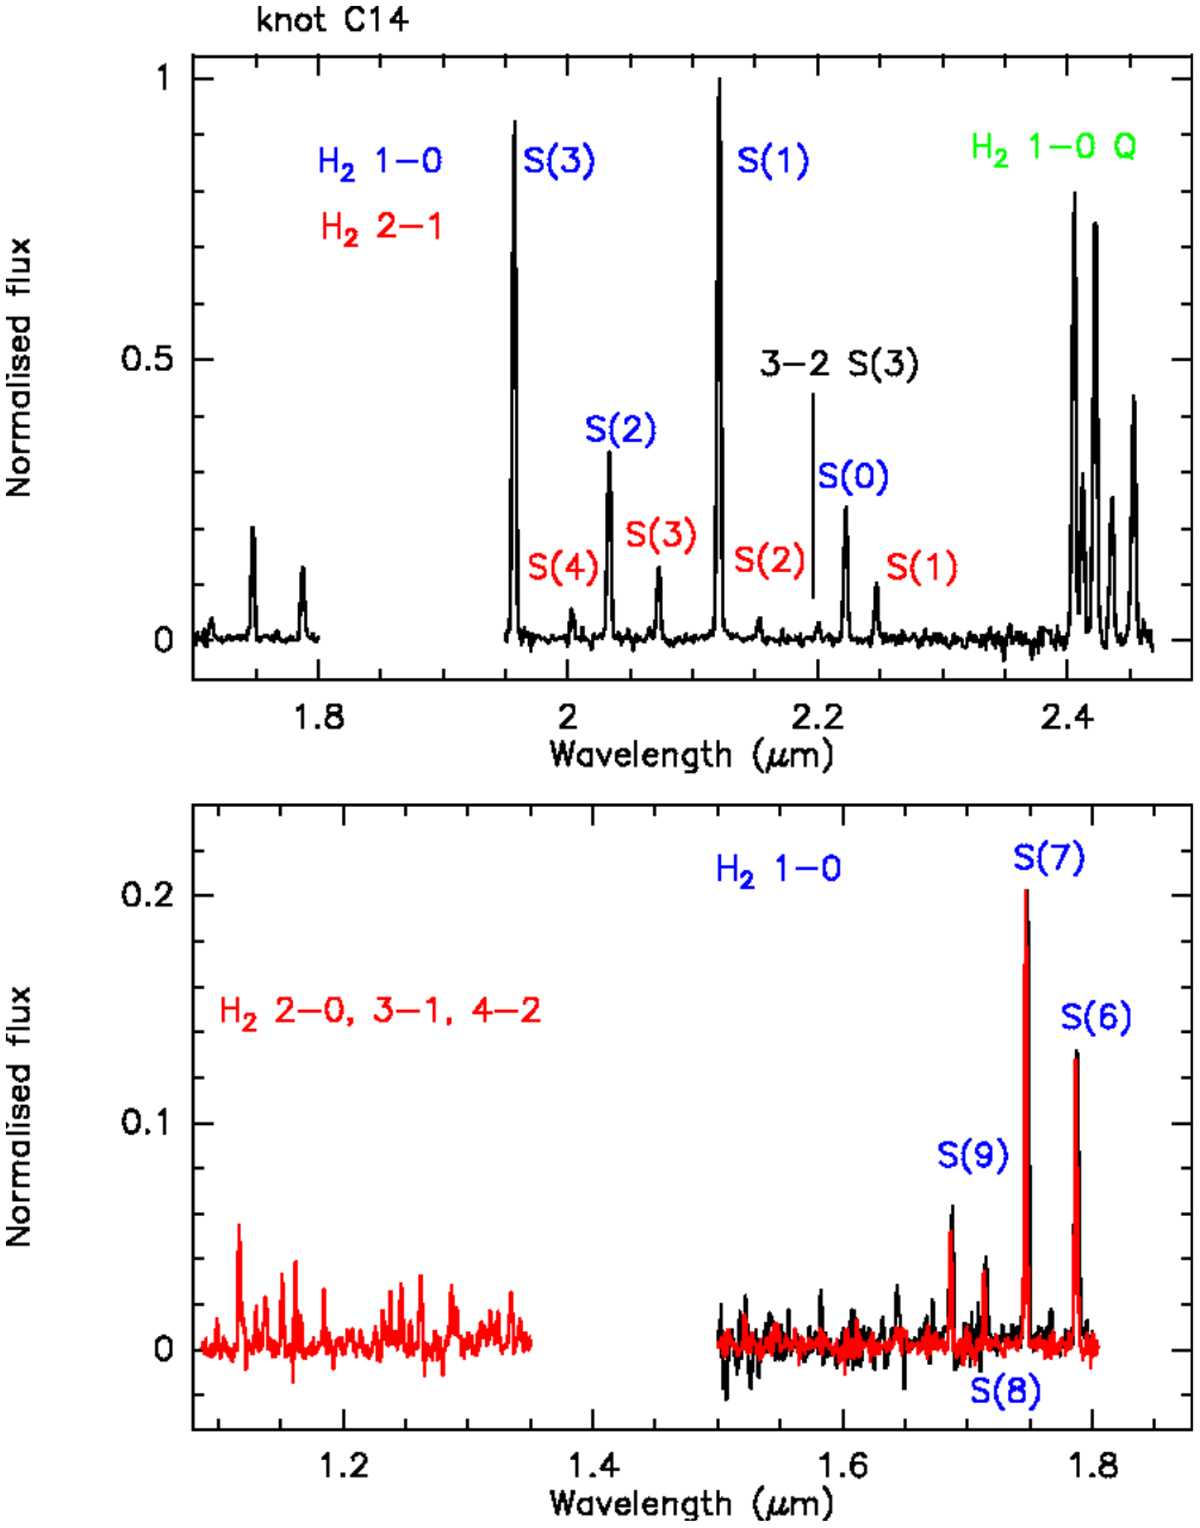
HK and JH spectrum of knot C14. The flux scale in HK (black) is normalised to the peak flux density of the H2 1–0 S(1) emission, and the JH spectrum (red) has been scaled such that line H2 1–0 S(7) exhibits the same normalised flux in the JH and HK spectra. The identified molecular hydrogen ro-vibrational lines are indicated.
Current usage metrics show cumulative count of Article Views (full-text article views including HTML views, PDF and ePub downloads, according to the available data) and Abstracts Views on Vision4Press platform.
Data correspond to usage on the plateform after 2015. The current usage metrics is available 48-96 hours after online publication and is updated daily on week days.
Initial download of the metrics may take a while.