Fig. 5.
Download original image
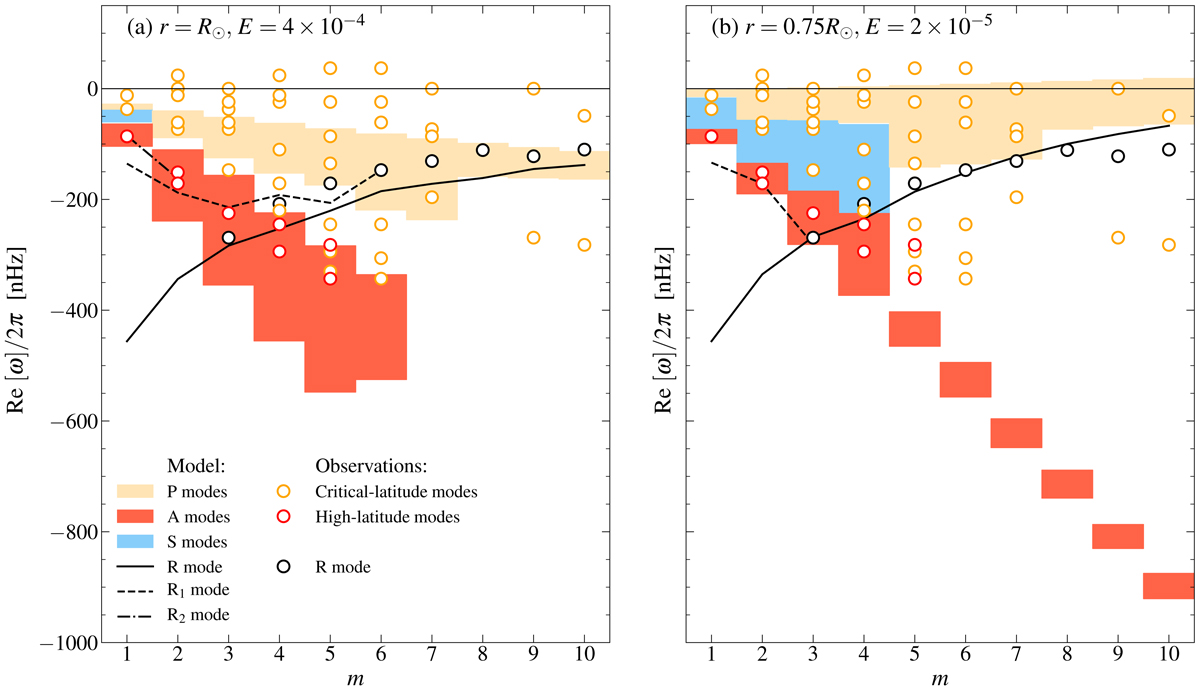
Model dispersion relations for all the modes with −Im[ω]/2π < 100 nHz. Shown are the Rossby modes (black curves for R, R1, and R2), the high-latitude modes (red area), the strongly damped modes (blue area), and the critical-latitude modes (orange area). The differential rotation is solar (N = 30), both at the surface (r = R⊙ and E = 4 × 10⁻⁴, left panel) and at the bottom of the convection zone (r = 0.75 R⊙ and E = 2 × 10⁻⁵, right panel). Frequencies are expressed in the Carrington frame of reference. The symbols show the observed modes reported by Gizon et al. (2021).
Current usage metrics show cumulative count of Article Views (full-text article views including HTML views, PDF and ePub downloads, according to the available data) and Abstracts Views on Vision4Press platform.
Data correspond to usage on the plateform after 2015. The current usage metrics is available 48-96 hours after online publication and is updated daily on week days.
Initial download of the metrics may take a while.