Open Access
Fig. C.8.
Download original image
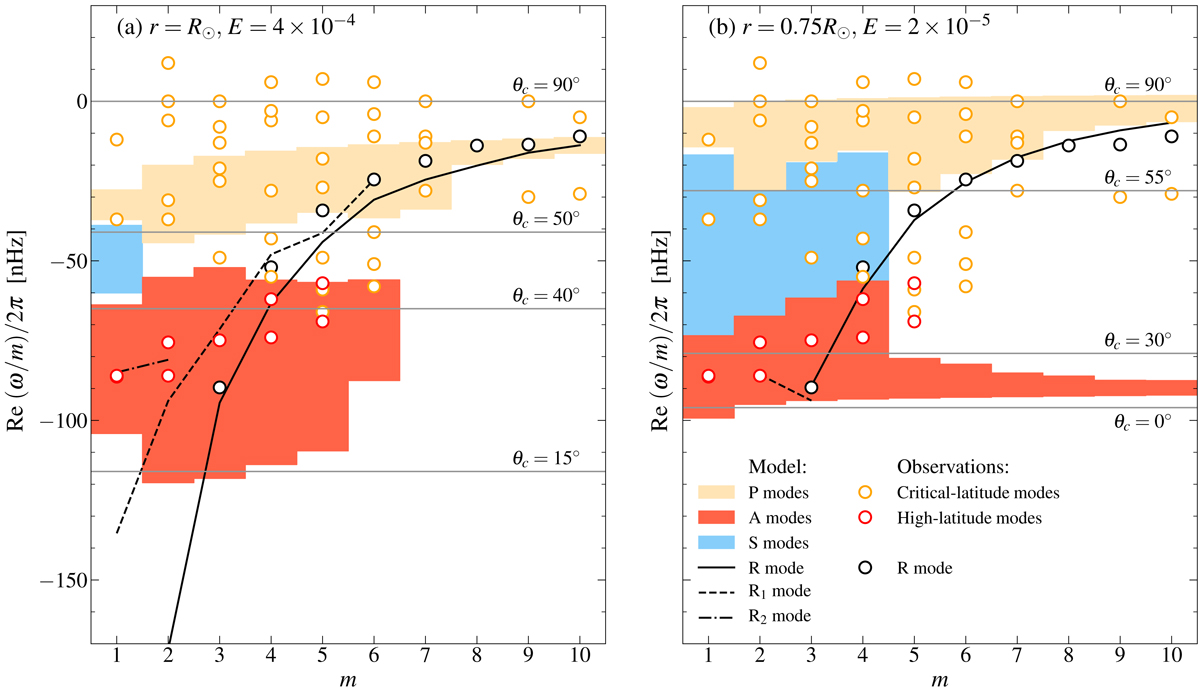
Dispersion relation diagrams for all the modes with |Im[ω]/2π|< 100 nHz. This figure is similar to Fig. 5, but the ordinate has been replaced by ω/m so that the critical latitudes occur on horizontal lines. A few selected critical (co)latitudes θc are highlighted (horizontal gray lines)
Current usage metrics show cumulative count of Article Views (full-text article views including HTML views, PDF and ePub downloads, according to the available data) and Abstracts Views on Vision4Press platform.
Data correspond to usage on the plateform after 2015. The current usage metrics is available 48-96 hours after online publication and is updated daily on week days.
Initial download of the metrics may take a while.