Open Access
Fig. C.7.
Download original image
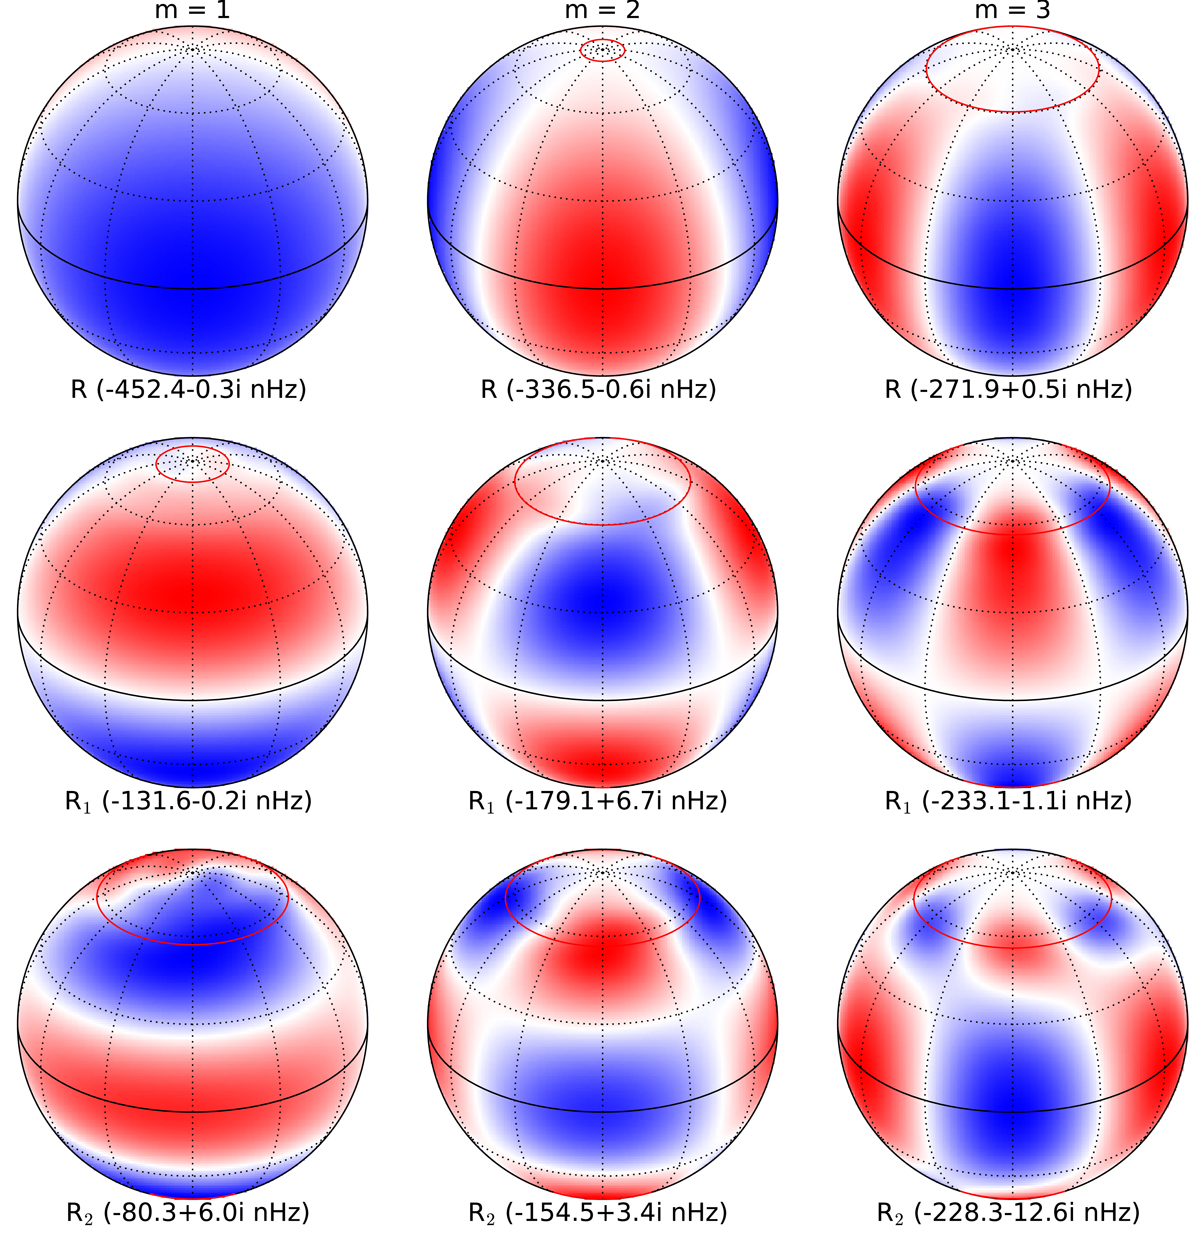
Stream functions Ψ(θ, ϕ, t = 0) for the m = 1, 2, and 3 Rossby modes R, R1, and R2, some of which may be unstable. The differential rotation is that of the Sun’s surface (temporal average) and the Ekman number is E = 2 × 10⁻⁴. The red curves show the latitudes of the viscous critical layers.
Current usage metrics show cumulative count of Article Views (full-text article views including HTML views, PDF and ePub downloads, according to the available data) and Abstracts Views on Vision4Press platform.
Data correspond to usage on the plateform after 2015. The current usage metrics is available 48-96 hours after online publication and is updated daily on week days.
Initial download of the metrics may take a while.