Open Access
Fig. 5
Download original image
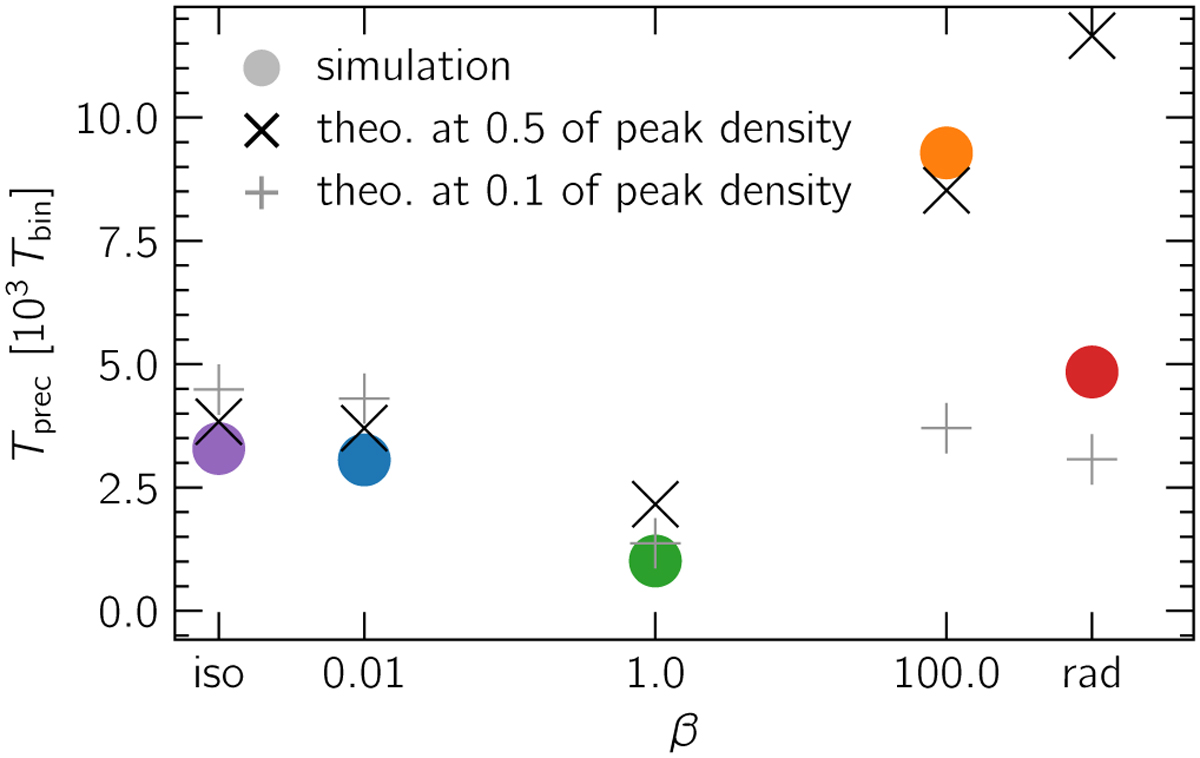
Precession period of the disc (coloured dots) for all models with ebin = 0.3. For comparison, the 3-body precession period for the 10% and 50% peak density ellipse are plotted with “+” and “x”. For the 3-body precession, the semi-major axis and eccentricity have been averaged over 4000 Tbin.
Current usage metrics show cumulative count of Article Views (full-text article views including HTML views, PDF and ePub downloads, according to the available data) and Abstracts Views on Vision4Press platform.
Data correspond to usage on the plateform after 2015. The current usage metrics is available 48-96 hours after online publication and is updated daily on week days.
Initial download of the metrics may take a while.