Open Access
Fig. 6.
Download original image
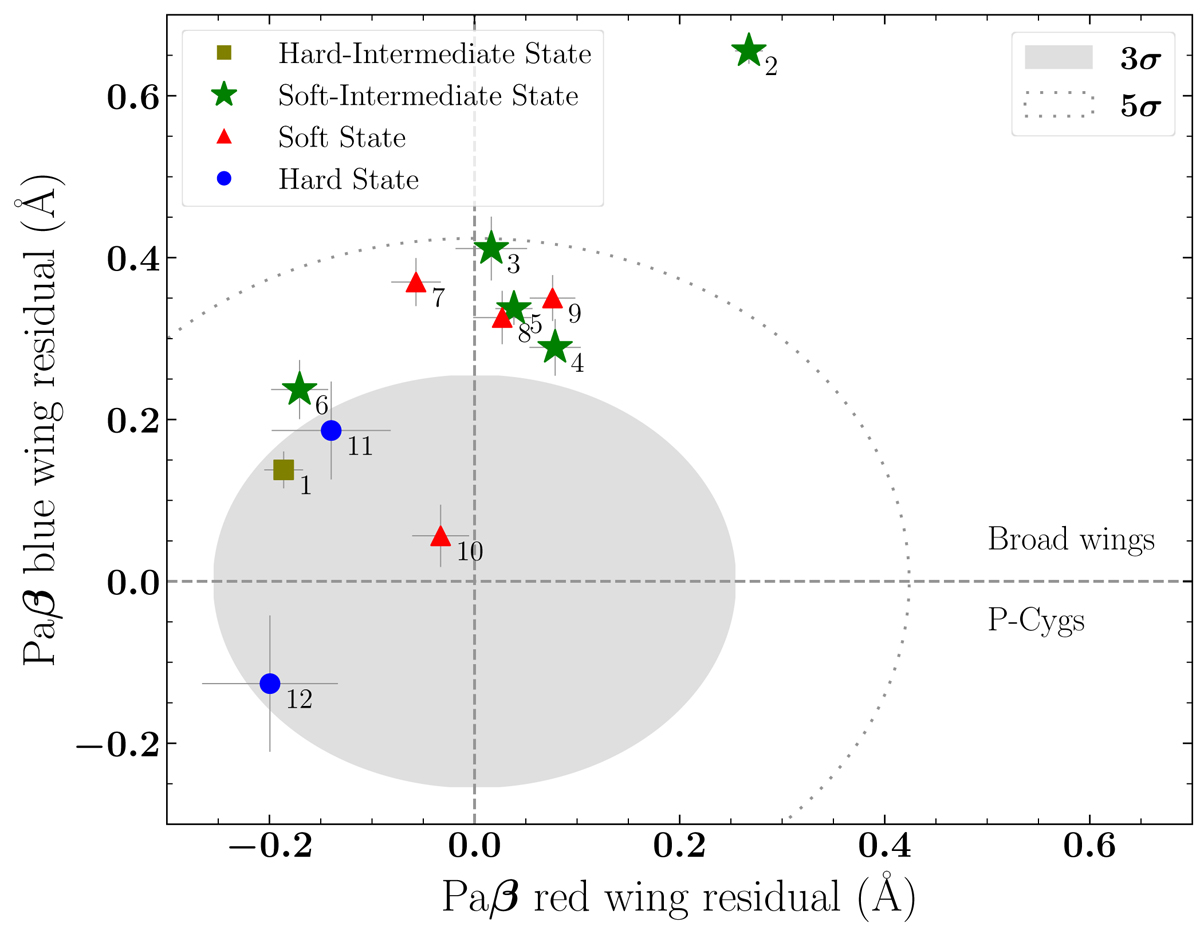
Paβ excesses diagnostic diagram. Symbols and colour codes have the same meanings as in Fig. 1. The grey region and dotted line indicate the 3σ and 5σ contours, respectively. Epochs showing wind-related signatures are expected to lie in the right quadrants.
Current usage metrics show cumulative count of Article Views (full-text article views including HTML views, PDF and ePub downloads, according to the available data) and Abstracts Views on Vision4Press platform.
Data correspond to usage on the plateform after 2015. The current usage metrics is available 48-96 hours after online publication and is updated daily on week days.
Initial download of the metrics may take a while.