Fig. 3.
Download original image
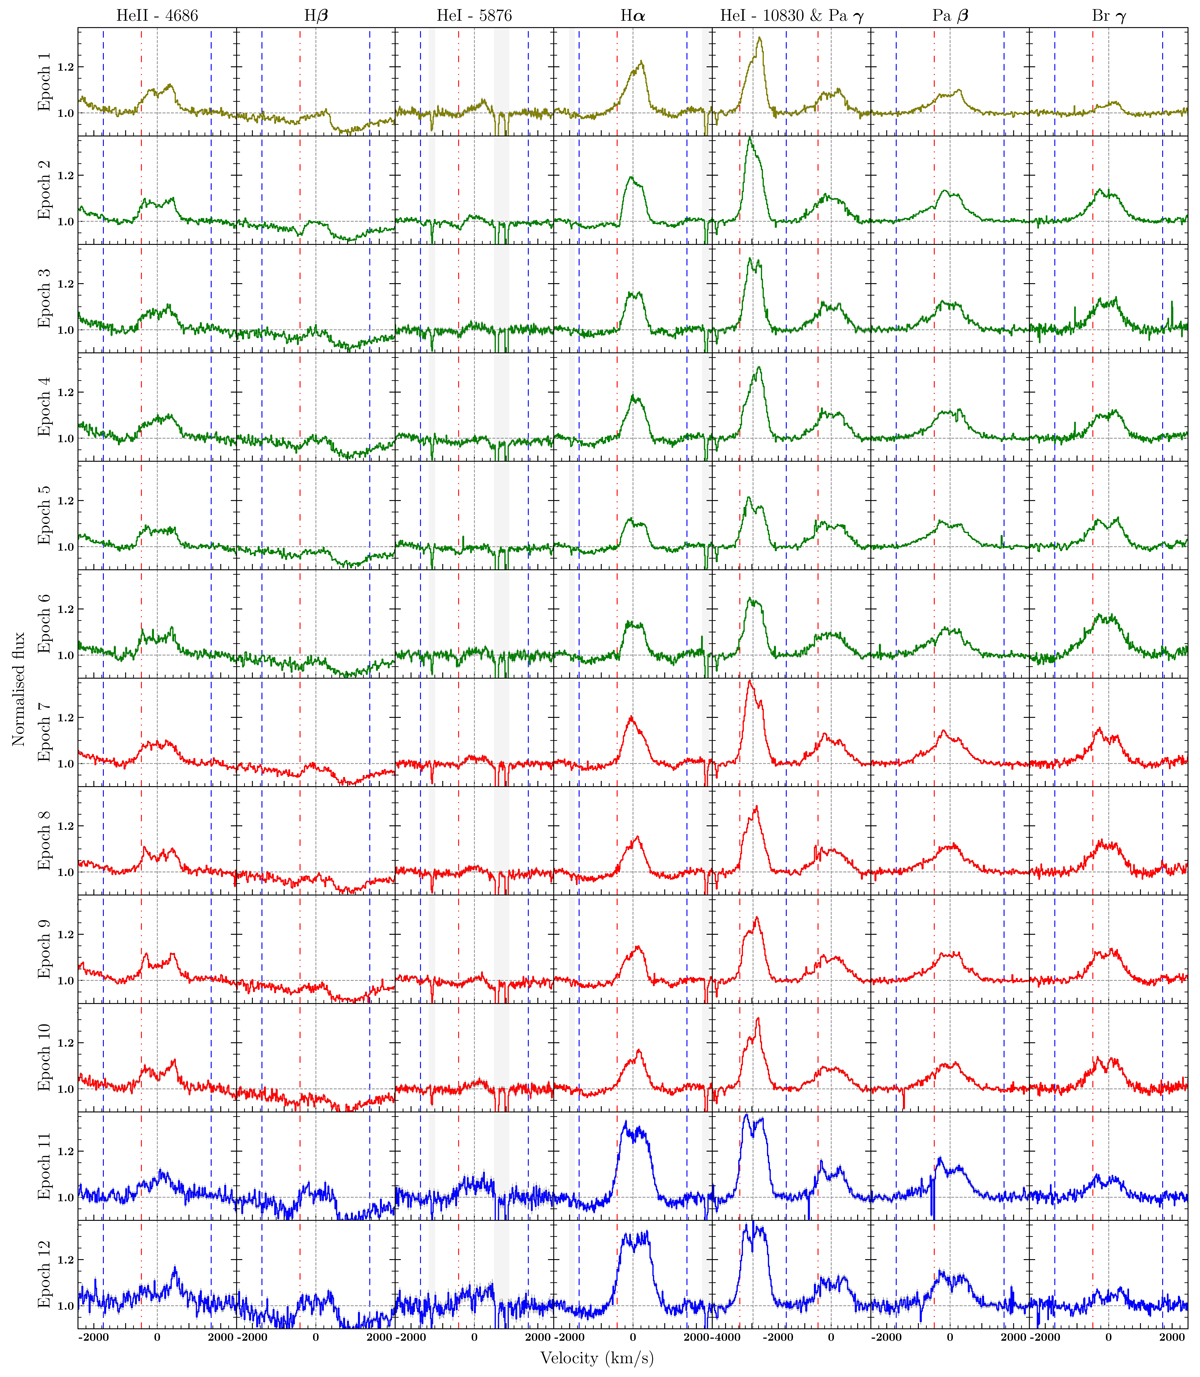
Evolution of the most relevant emission lines. The colour code is the same as in Fig. 1. The vertical dashed blue and dashed-dotted red lines mark ±1700 km s−1 and −500 km s−1, velocities of the blue wing and the absorption trough of Paβ, respectively (in epochs #2 and #6). Grey bands indicate regions contaminated by DIBs or tellurics. The emission at −2500 km s−1 in the He II–4686 column is produced by the Bowen blend.
Current usage metrics show cumulative count of Article Views (full-text article views including HTML views, PDF and ePub downloads, according to the available data) and Abstracts Views on Vision4Press platform.
Data correspond to usage on the plateform after 2015. The current usage metrics is available 48-96 hours after online publication and is updated daily on week days.
Initial download of the metrics may take a while.