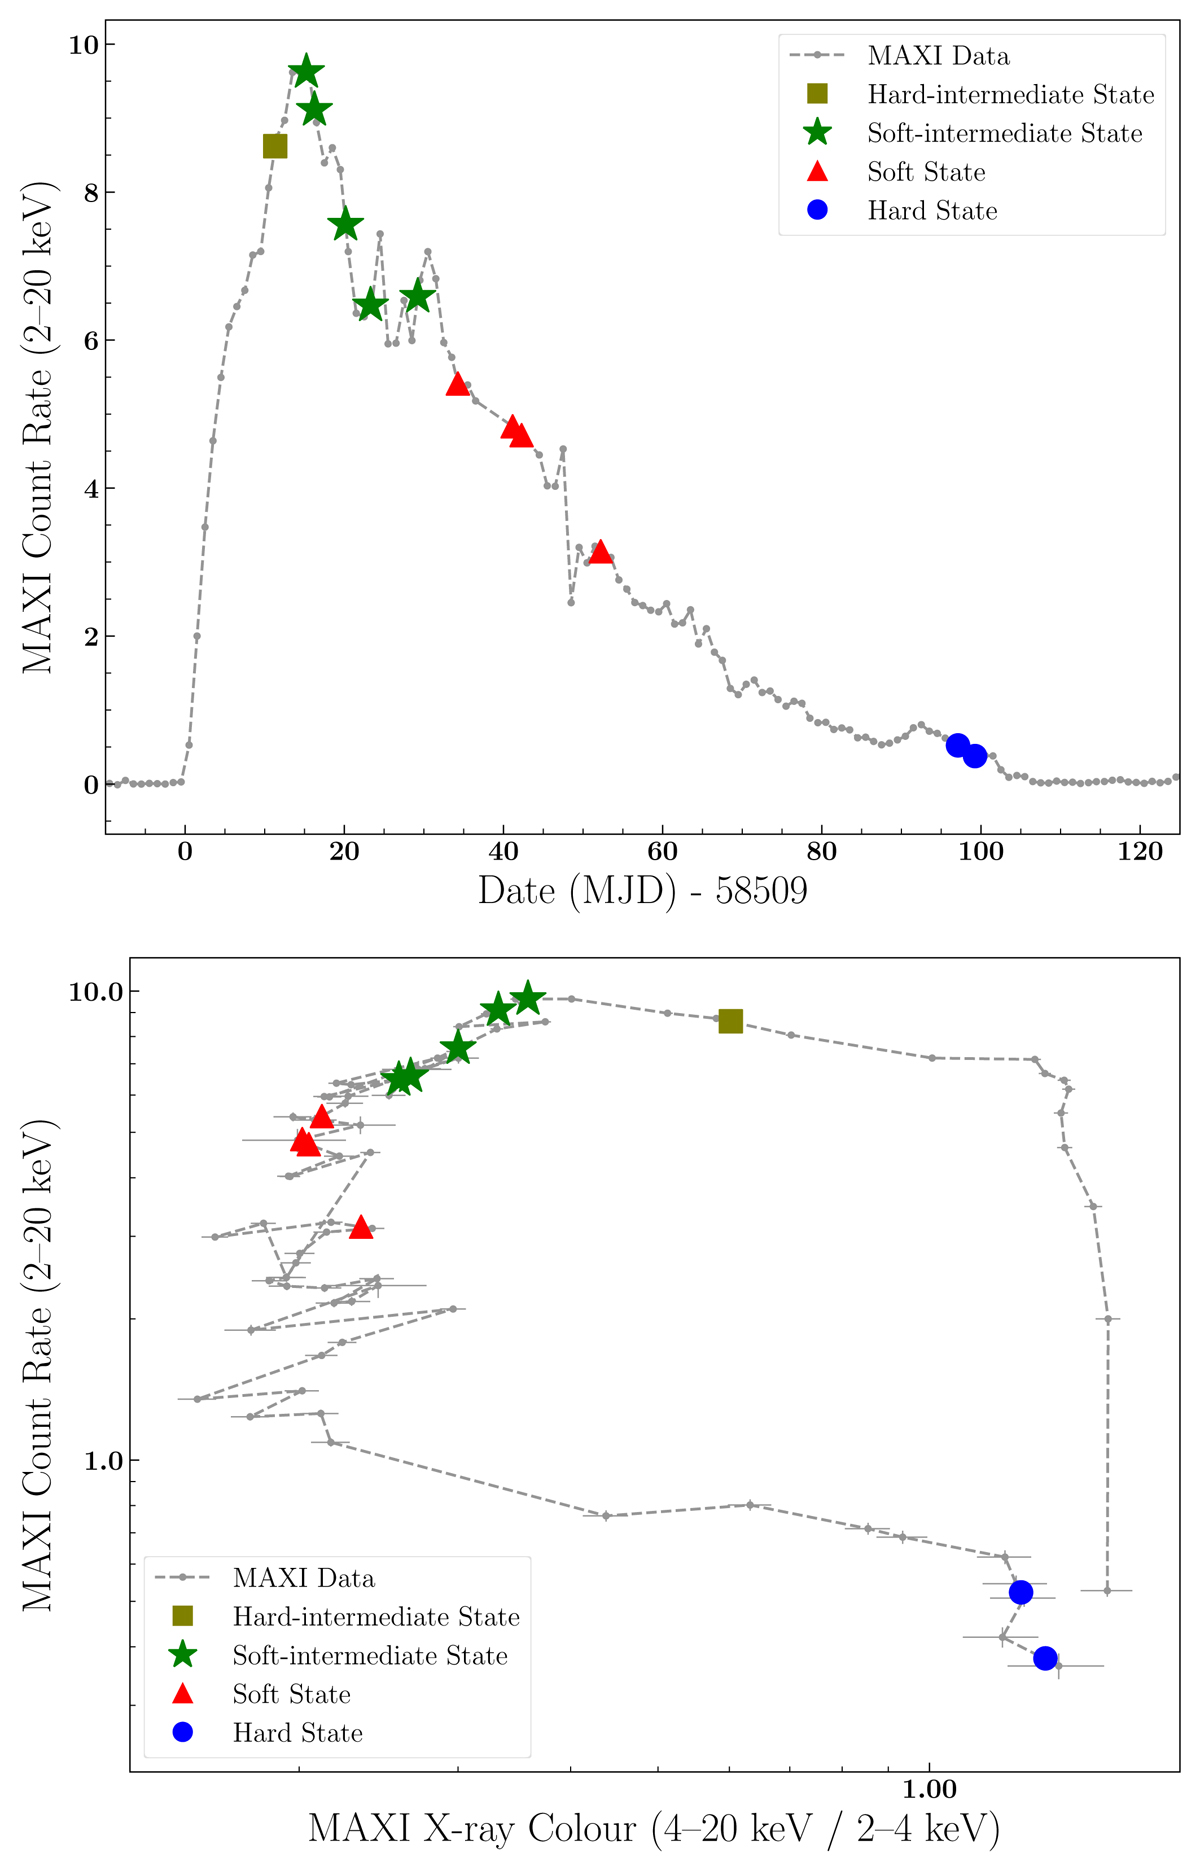
Fig. 1.
Download original image
Light curve (upper panel) and HID (lower panel) of J1348 during its 2019 outburst (MAXI data between MJD 58509 and 58634). The small grey dots represent X-ray data, and the coloured symbols mark the interpolated position for each X-shooter epoch. For the HID we only considered data with count rates exceeding 0.025 photons cm−2 s−1 in each band. The X-ray colour is defined as the ratio between the hard (4–20 keV) and the soft (2–4 keV) count rates. The source displays the classic hysteresis loop in the anticlockwise direction.
Current usage metrics show cumulative count of Article Views (full-text article views including HTML views, PDF and ePub downloads, according to the available data) and Abstracts Views on Vision4Press platform.
Data correspond to usage on the plateform after 2015. The current usage metrics is available 48-96 hours after online publication and is updated daily on week days.
Initial download of the metrics may take a while.