Fig. 2
Download original image
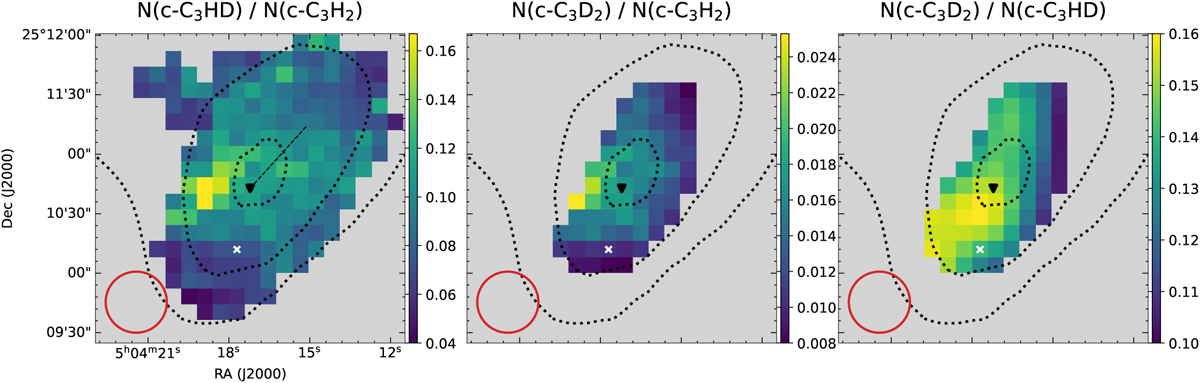
Deuteration maps of c-C3H2. Only pixels above 3σ are plotted, pixels below are grey. The dashed black lines represent 90, 50, and 30% of the H2 column density peak value derived from Herschel maps (Spezzano et al. 2016), 2.8 × 1022 cm−2. The black triangle indicates the dust continuum peak (Ward-Thompson et al. 1999), and the white cross shows the c-C3H2 peak. The HPBW is indicated by a red circle in each panel. The dashed line in the left panel shows the cut used to produce Fig. 6.
Current usage metrics show cumulative count of Article Views (full-text article views including HTML views, PDF and ePub downloads, according to the available data) and Abstracts Views on Vision4Press platform.
Data correspond to usage on the plateform after 2015. The current usage metrics is available 48-96 hours after online publication and is updated daily on week days.
Initial download of the metrics may take a while.