Fig. 1
Download original image
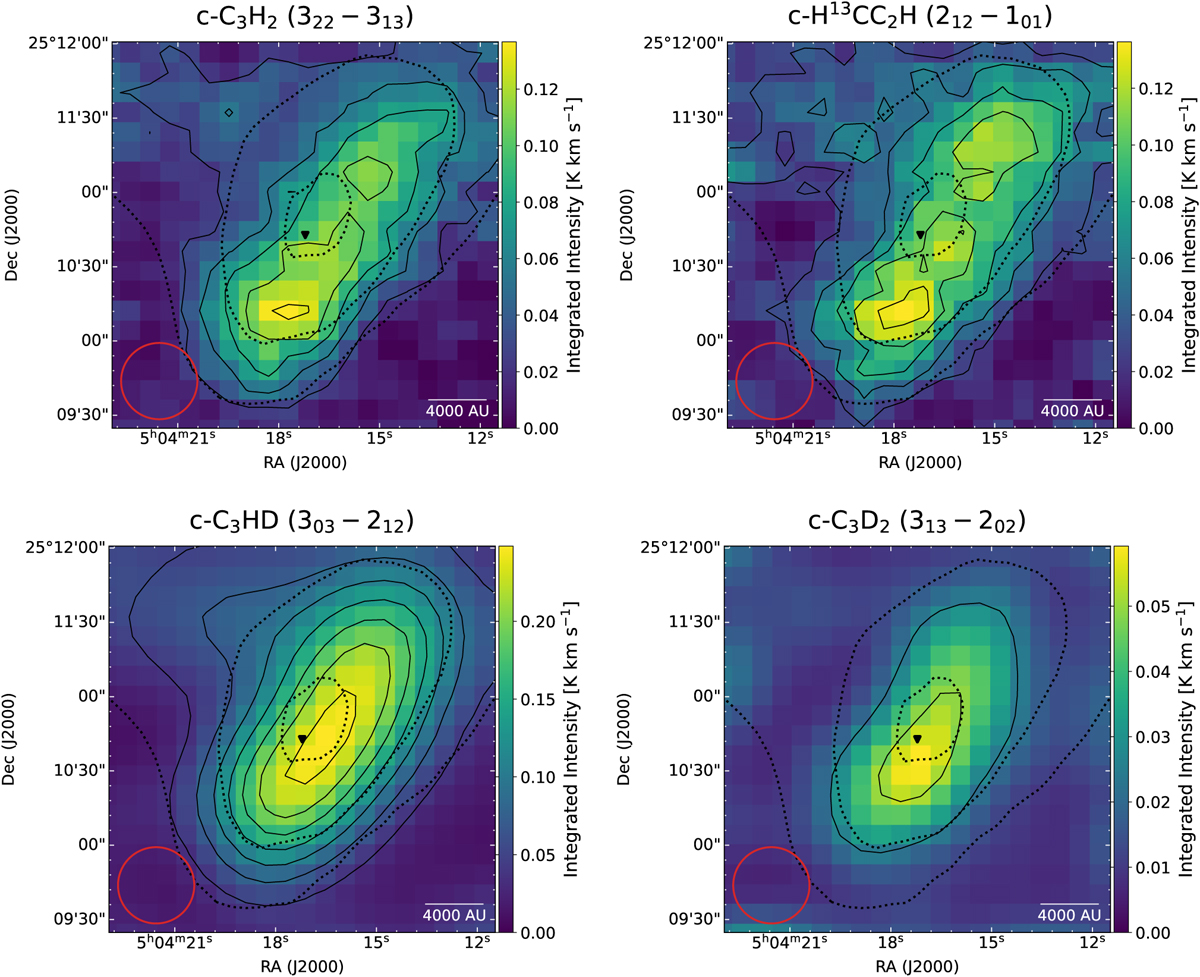
Integrated intensity maps of the observed transitions. The dashed black lines represent 90, 50, and 30% of the H2 column density peak value derived from Herschel maps (Spezzano et al. 2016), 2.8 × 1022 cm−2. The solid lines represent contours of the integrated intensity starting at 3σ with steps of 3σ. From top to bottom and left to right, the average errors on the integrated intensity are 9, 9, 12, and 8 in units of mKkm s−1. The dust peak is indicated by the black triangle. The beam size of the 30 m telescope, HPBW = 31″, is shown by the red circle in the bottom left corner of each panel, and the scale bar is shown in the bottom right corners.
Current usage metrics show cumulative count of Article Views (full-text article views including HTML views, PDF and ePub downloads, according to the available data) and Abstracts Views on Vision4Press platform.
Data correspond to usage on the plateform after 2015. The current usage metrics is available 48-96 hours after online publication and is updated daily on week days.
Initial download of the metrics may take a while.