Fig. 7.
Download original image
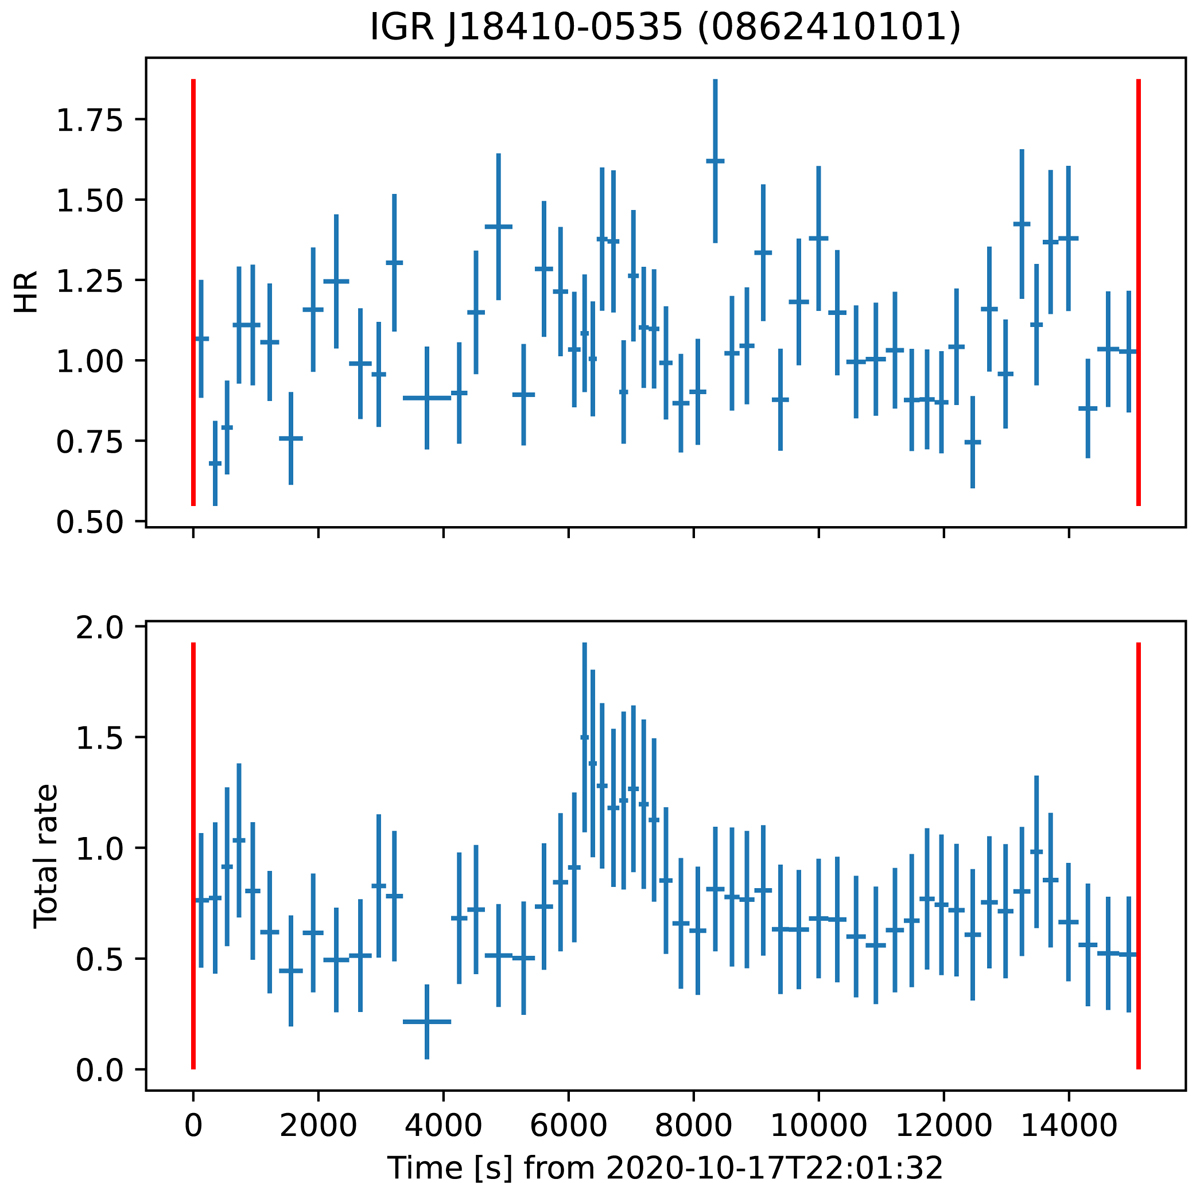
Timing analysis of the of the 2020 observation of IGR J18410−0535 (OBSID 0862410101). Lower panel: combined EPIC-pn+MOS1+MOS2 light curve in 0.5–10 keV energy range. Upper panel: hardness ratio between the light curves in the bands 3.5–10 keV and 0.5–3.5 keV rebinned at a minimum S/N of 8. There are no significant variations in the hardness ratio, and thus the Bayesian algorithm identified a single time interval for the spectral extraction (red lines, corresponding to the whole observation).
Current usage metrics show cumulative count of Article Views (full-text article views including HTML views, PDF and ePub downloads, according to the available data) and Abstracts Views on Vision4Press platform.
Data correspond to usage on the plateform after 2015. The current usage metrics is available 48-96 hours after online publication and is updated daily on week days.
Initial download of the metrics may take a while.