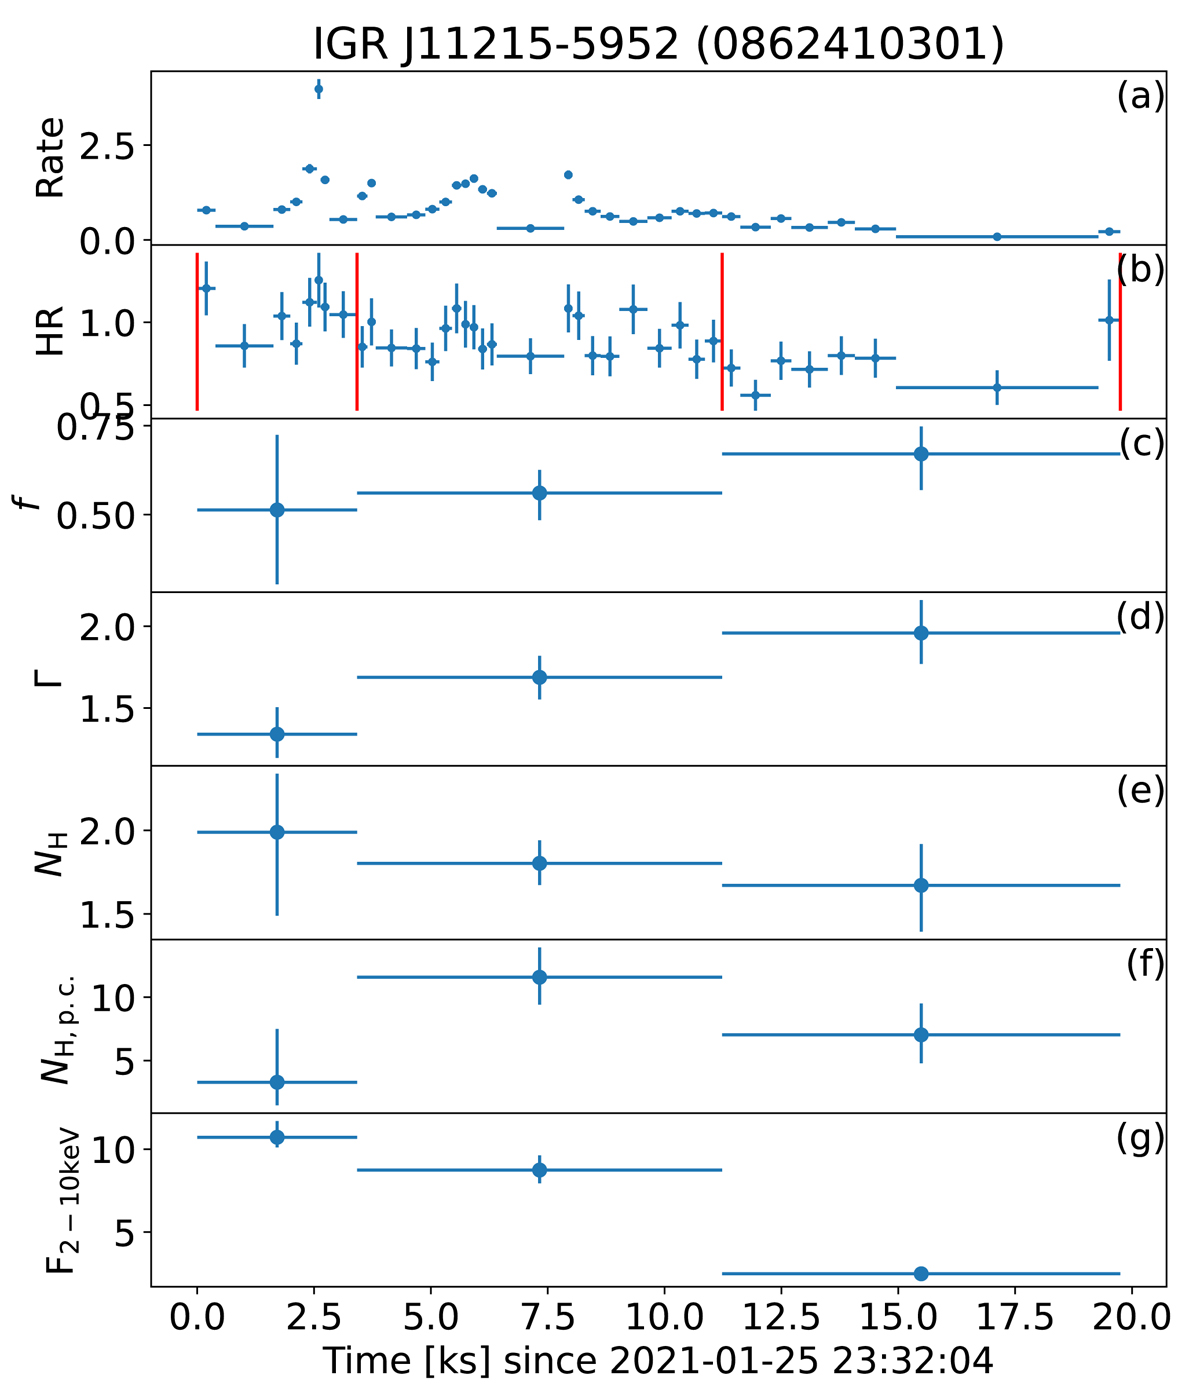
Fig. 6.

Download original image
Plot of light curve, HR, and best-fit parameters as a function of time obtained from the HR-resolved spectral analysis of the XMM-Newton observation of IGR J11215−5952. Panel a: source count rate in the 0.5–10 keV bands, after adaptive rebinning with minimum S/N of 15 in the light curve extracted for 0.5–3 keV; panel b: HR between the 3–10 keV and 0.5–3 keV energy-resolved light curves with the identified time intervals for the spectral extraction (red lines); panel c: f, covering fraction of the partial absorber; panel d: Γ, power-law photon index; panel e: NH, absorption column density along the direction to the source (including Galactic absorption); panel f: NH, pc, absorption column density of the partial absorber (representing the absorption column density local to the source; PCFABS in XSPEC); panel g: F2 − 10 keV, measured power-law flux in the 2–10 keV energy range not corrected for absorption for the EPIC-pn in units of 10−12 erg s−1 cm−2.
Current usage metrics show cumulative count of Article Views (full-text article views including HTML views, PDF and ePub downloads, according to the available data) and Abstracts Views on Vision4Press platform.
Data correspond to usage on the plateform after 2015. The current usage metrics is available 48-96 hours after online publication and is updated daily on week days.
Initial download of the metrics may take a while.


