Fig. 3.

Download original image
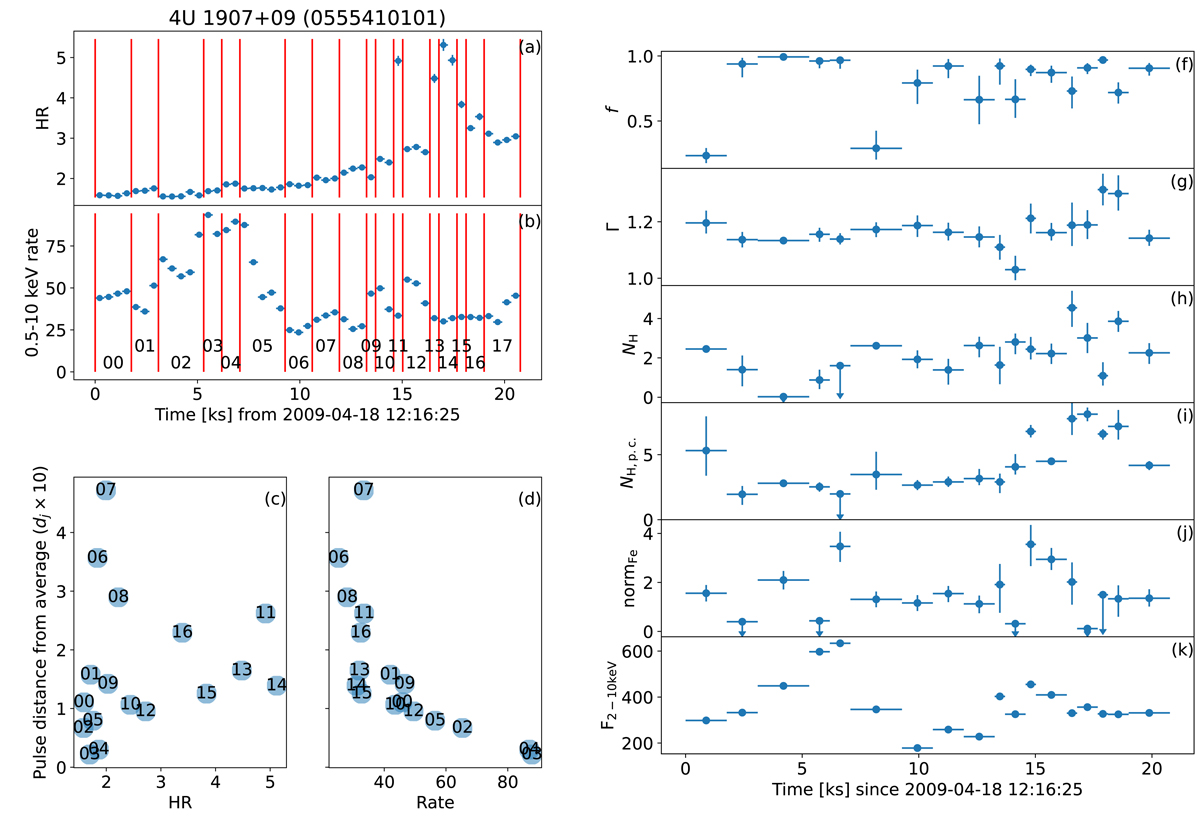
Timing analysis of 4U 1907+09. Top left, panel a: hardness ratio of the combined EPIC-pn, MOS1, MOS2 light curves (3–10 keV/0.5–3 keV). Top left, panel b: total rate in the 0.5–10 keV energy range. Bottom left, panel c: distance dj from the average for each pulse profile as function of HR. Bottom left, panel d: distance dj from the average for each pulse profile as function of the total rate. The numbers indicate the different intervals identified in panel b (see Eq. (1) for the definition of dj). Right: plot of the best-fit parameters as a function of time obtained from the HR-resolved spectral analysis of the XMM-Newton observation of 4U 1907+09. The parameters reported in the different panels are those introduced in Table 2 and described in the text.
Current usage metrics show cumulative count of Article Views (full-text article views including HTML views, PDF and ePub downloads, according to the available data) and Abstracts Views on Vision4Press platform.
Data correspond to usage on the plateform after 2015. The current usage metrics is available 48-96 hours after online publication and is updated daily on week days.
Initial download of the metrics may take a while.


