Open Access
Fig. 11.
Download original image
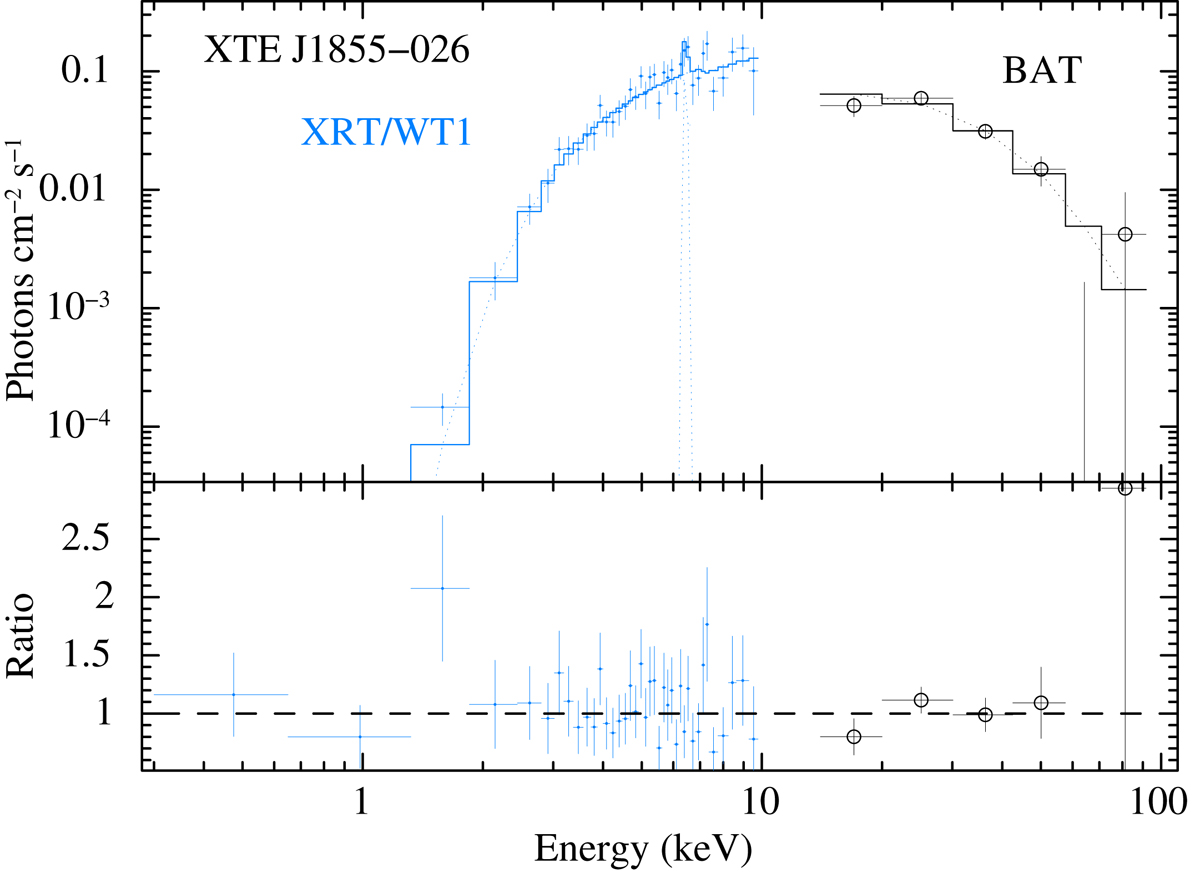
Spectroscopy of the 2011 September 18 outburst of XTE J1855−026. Top panel: unfolded spectra of the nearly simultaneous XRT/WT1 data (blue crosses) and BAT DPH1 data (empty black circles) fit with an absorbed cut-off power-law model. Bottom panel: data/model ratio of the fit.
Current usage metrics show cumulative count of Article Views (full-text article views including HTML views, PDF and ePub downloads, according to the available data) and Abstracts Views on Vision4Press platform.
Data correspond to usage on the plateform after 2015. The current usage metrics is available 48-96 hours after online publication and is updated daily on week days.
Initial download of the metrics may take a while.