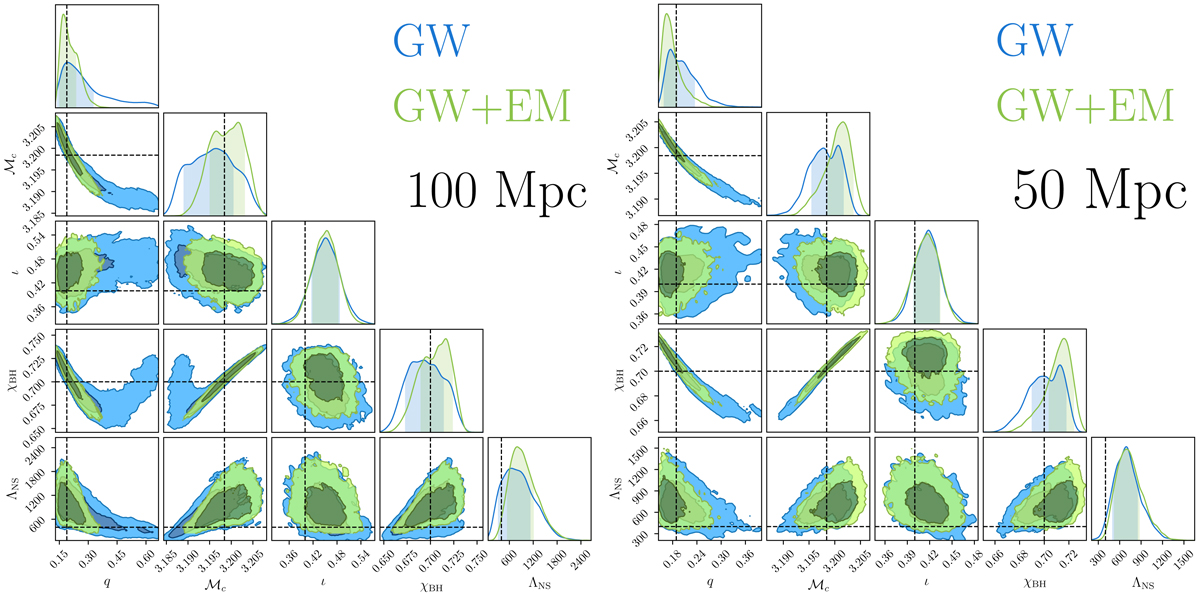
Fig. 6.
Download original image
Posterior distributions of the parameters θGW as inferred for our fiducial binary at dL = 100 Mpc (left panel) and dL = 50 Mpc (right panel). Blue contours give the posterior distribution when only using the GW data, whereas the green contours give the posterior distribution when using both the GW and radio data. The dark and light shaded regions give the 68% and 95% confidence levels, respectively, for all posteriors shown. The fiducial injected values are indicated by the dashed black lines.
Current usage metrics show cumulative count of Article Views (full-text article views including HTML views, PDF and ePub downloads, according to the available data) and Abstracts Views on Vision4Press platform.
Data correspond to usage on the plateform after 2015. The current usage metrics is available 48-96 hours after online publication and is updated daily on week days.
Initial download of the metrics may take a while.