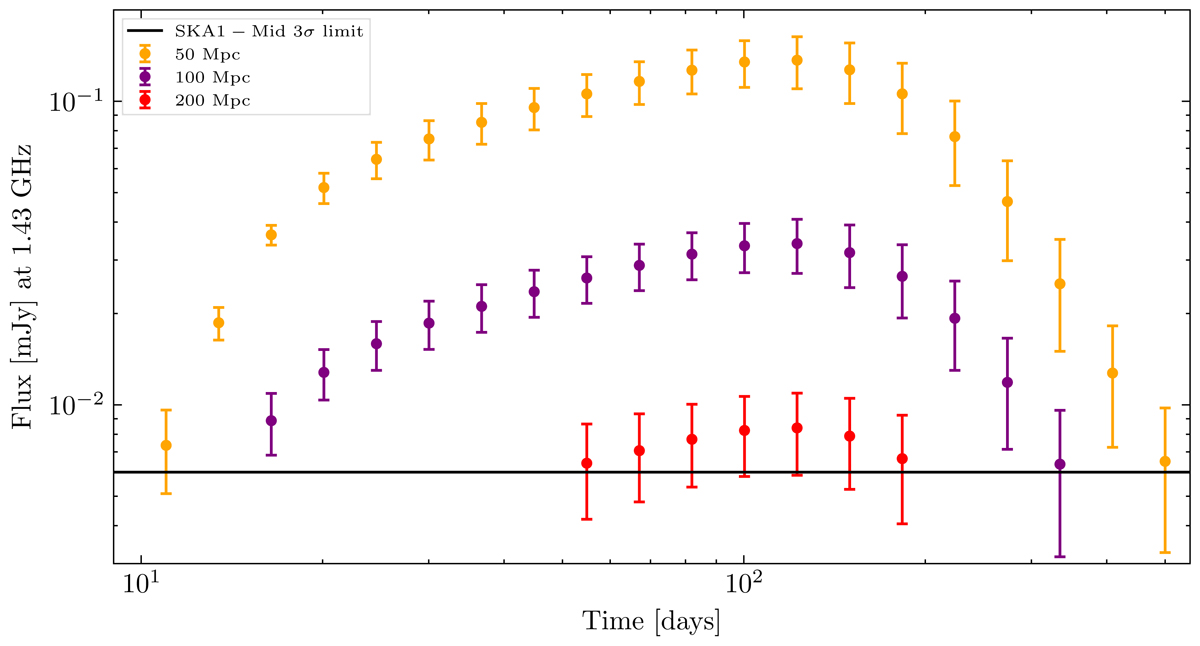
Fig. 5.
Download original image
sGRB afterglow radio light curves, computed with afterglowpy, of our fiducial binary at the nominal SKA1-Mid frequency, ν = 1.43 GHz. The curves are plotted on a log–log scale. Twenty simulated observations were taken between 11 and 500 days post-merger. The orange circles indicate the 20 observations above the 3σrms detection threshold when the binary is placed at dL = 50 Mpc. The purple circles indicate the 16 observations above the 3σrms detection threshold when the binary is placed at dL = 100 Mpc. The red circles indicate the seven observations above the 3σrms detection threshold when the binary is placed at dL = 200 Mpc. The solid black line shows the SKA1-Mid 3σrms detection threshold with σrms = 2 μJy. The error bars give the total error as a combination of the measurement error and the systematic error.
Current usage metrics show cumulative count of Article Views (full-text article views including HTML views, PDF and ePub downloads, according to the available data) and Abstracts Views on Vision4Press platform.
Data correspond to usage on the plateform after 2015. The current usage metrics is available 48-96 hours after online publication and is updated daily on week days.
Initial download of the metrics may take a while.