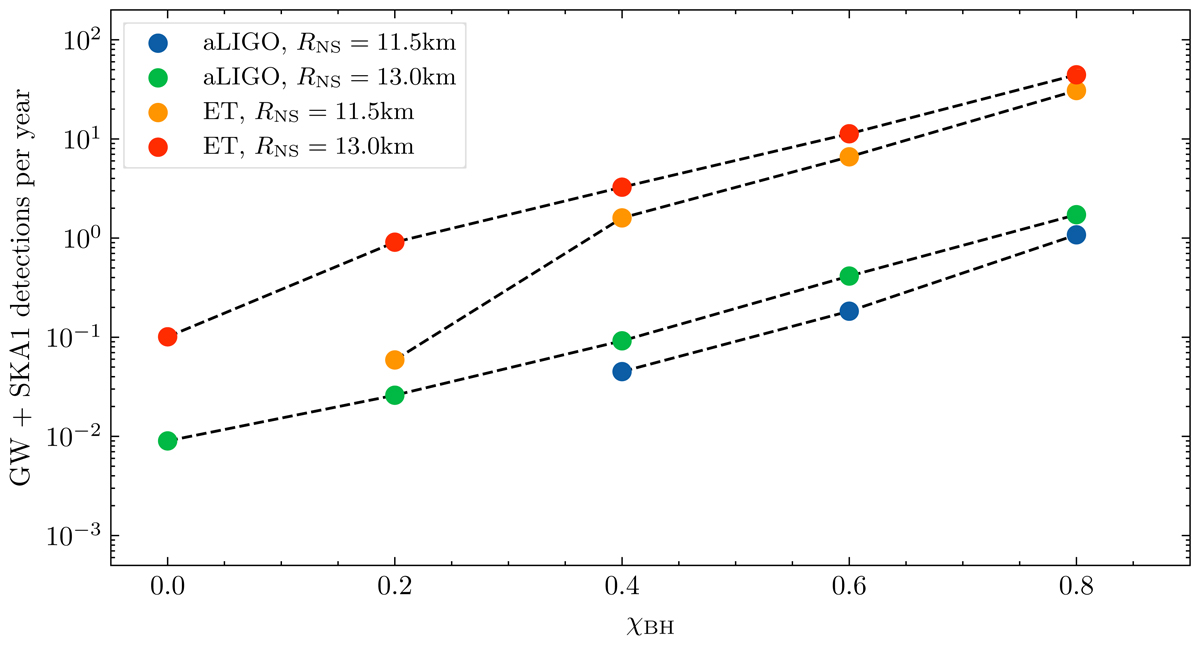
Fig. 3.
Download original image
Combined detection rate of BHNS mergers in our simulated population observed through their GW emission and their associated sGRB afterglow emission. The radio emission is observed with SKA1-Mid at nominal frequency and sensitivity. The GW emission is observed with either an aLIGO detector network (blue and green circles) or an ET detector network (orange and red circles). Either a soft NS EOS (RNS = 11.5 km) or a hard NS EOS (RNS = 13.0 km) is assumed. The detection rate is shown as a function of the BH spin (χBH). The dashed black lines are not computed but connect the points to guide the eye.
Current usage metrics show cumulative count of Article Views (full-text article views including HTML views, PDF and ePub downloads, according to the available data) and Abstracts Views on Vision4Press platform.
Data correspond to usage on the plateform after 2015. The current usage metrics is available 48-96 hours after online publication and is updated daily on week days.
Initial download of the metrics may take a while.