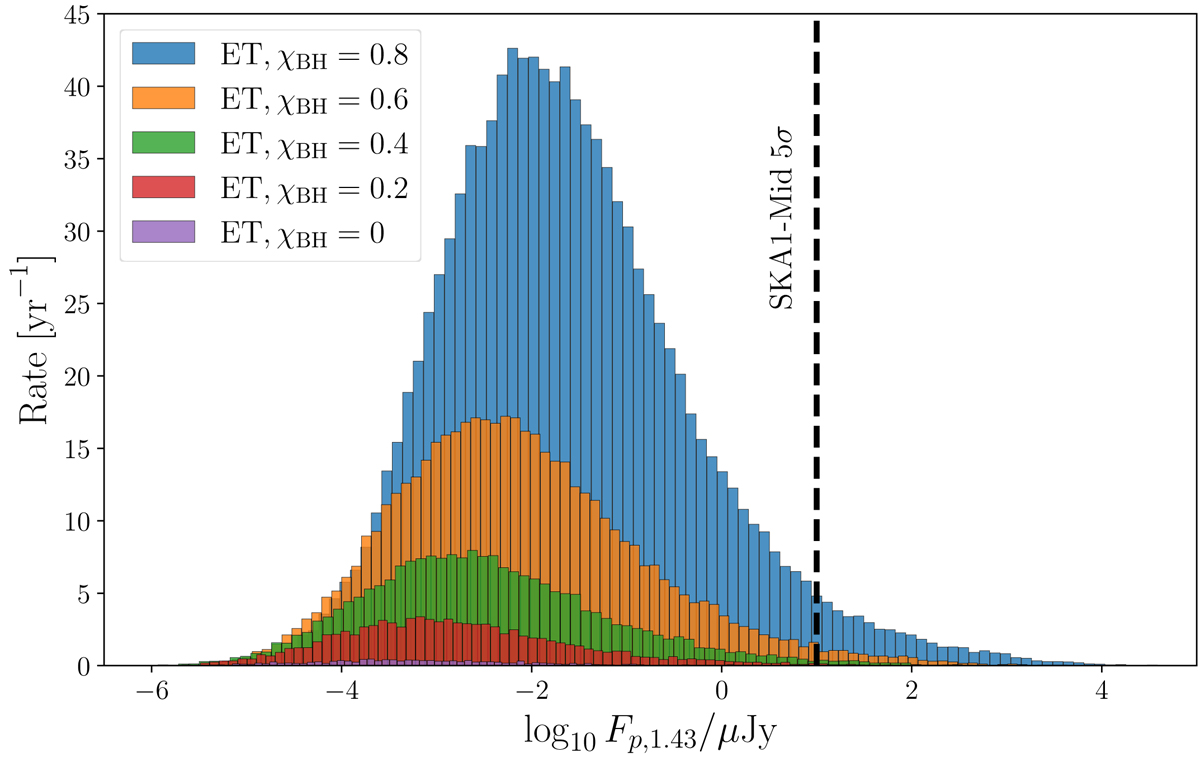
Fig. A.1.
Download original image
Flux distribution in log10 of sGRB afterglows associated with BHNS mergers detected in GWs with a 3G detector network that includes ET. The distributions are shown for different average BH spins: χBH = 0 (purple), 0.2 (red), 0.4 (green), 0.6 (orange), and 0.8 (blue). The vertical dashed line shows the SKA1-Mid 5σrms detection limit.
Current usage metrics show cumulative count of Article Views (full-text article views including HTML views, PDF and ePub downloads, according to the available data) and Abstracts Views on Vision4Press platform.
Data correspond to usage on the plateform after 2015. The current usage metrics is available 48-96 hours after online publication and is updated daily on week days.
Initial download of the metrics may take a while.