Fig. 6

Download original image
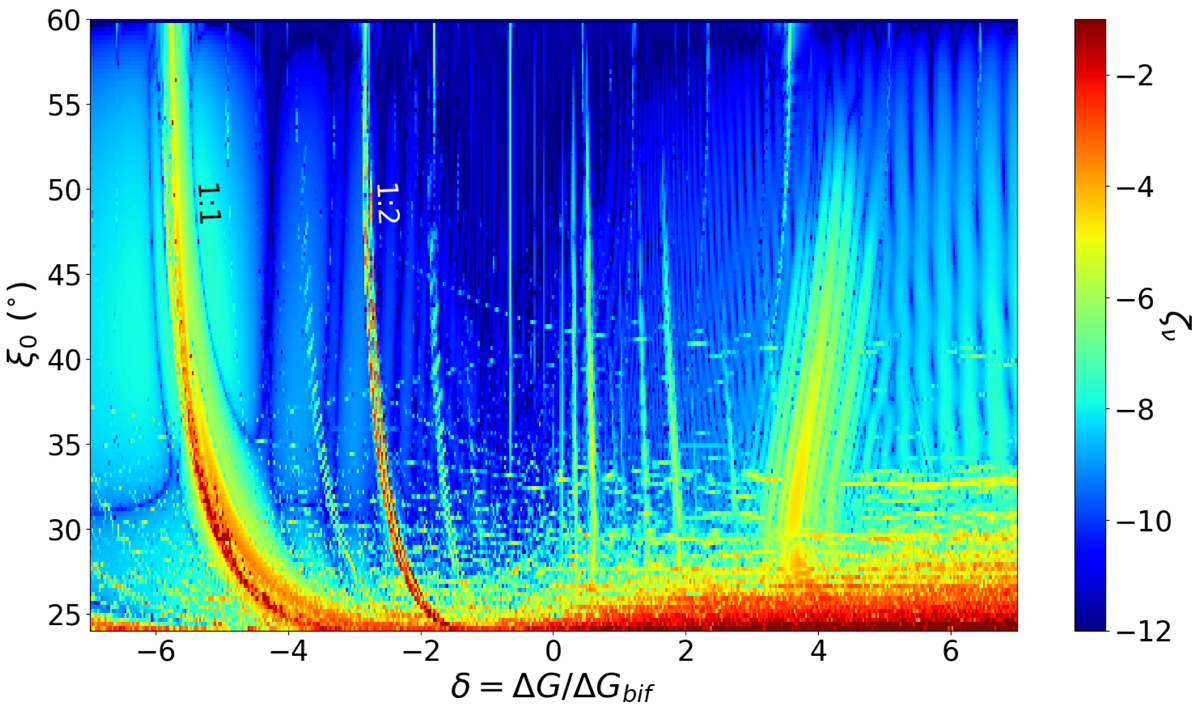
Diffusion index ζν as a function of δ and ξ0. The planetary masses are as in Table 1 and the chain is 1:1:2. The top of the figure, at ξ0 ≈ 60°, is the main branch. The blue-to-green regions are almost quasi-periodic (stable), while the red regions are chaotic (unstable). The secular resonances between the libration frequency ν and the precession frequency of the pericentres ν3, predicted by the analytical results (see Fig. 1), are visible, especially the resonance 1 : 1, which can lead to chaotic orbits for high enough values of the libration amplitude. The horseshoe-shaped orbits at the bottom are mostly chaotic, as expected, since m1 + m2 = 2 × 10⁻⁴ is close to the limit 3 × 10⁻⁴ of their existence (Leleu et al. 2015). The main branch around the 1:1 resonance between ν and ν3 is tidally attractive (see Fig. 7). Systems undergoing tides entering this zone can either converge towards the top of the figure or can become completely chaotic.
Current usage metrics show cumulative count of Article Views (full-text article views including HTML views, PDF and ePub downloads, according to the available data) and Abstracts Views on Vision4Press platform.
Data correspond to usage on the plateform after 2015. The current usage metrics is available 48-96 hours after online publication and is updated daily on week days.
Initial download of the metrics may take a while.


