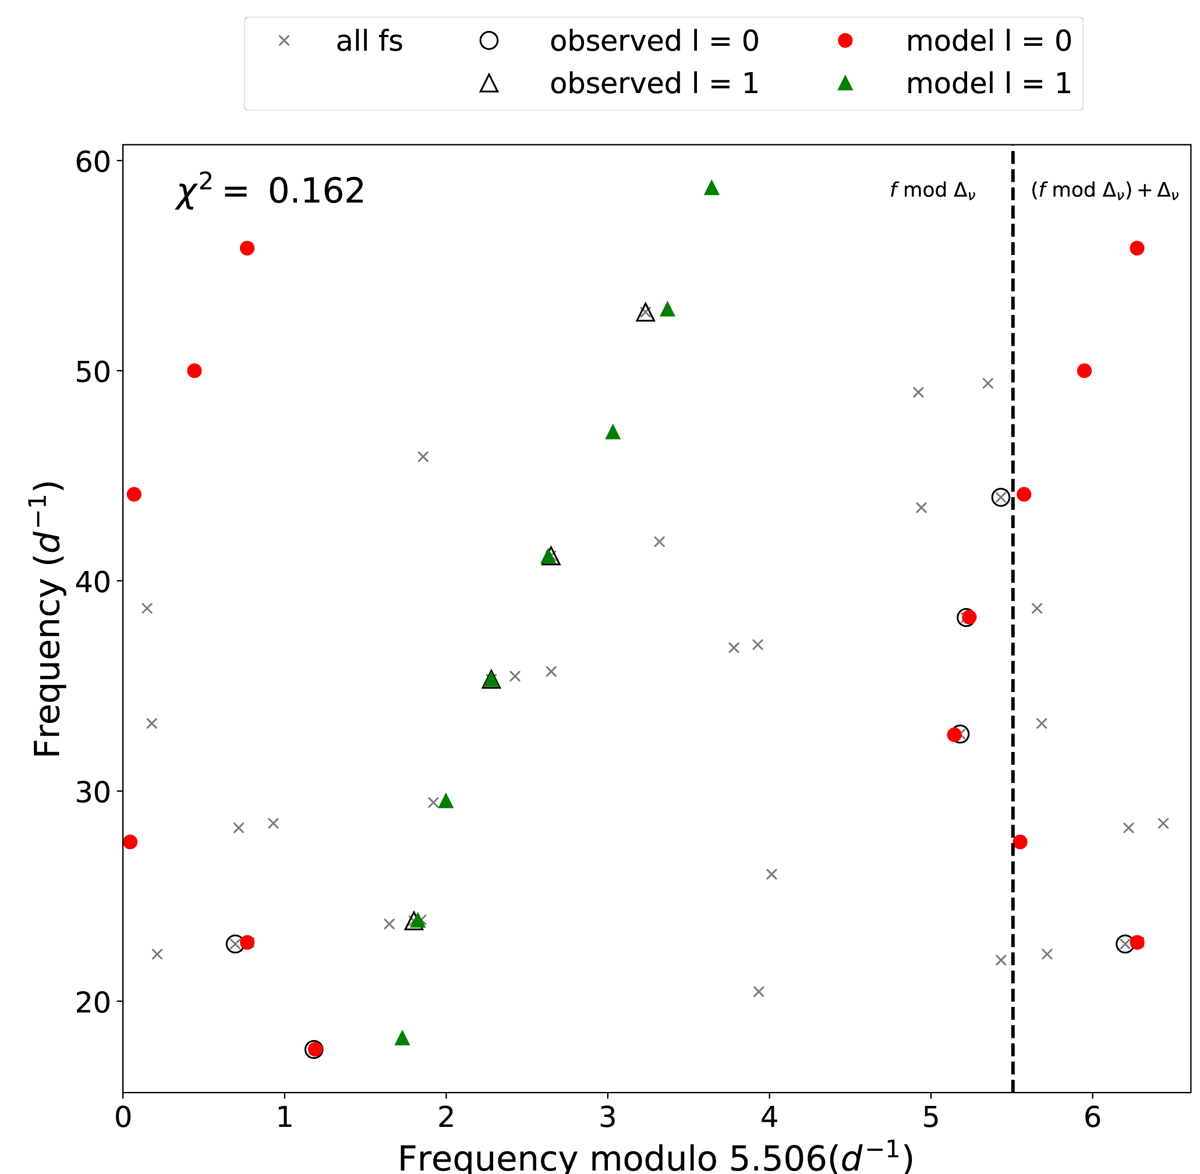
Fig. 6.
Download original image
Example output for automatic echelle diagram. The small grey crosses indicate all frequencies given to the algorithm as input. The open circles (triangles) are the radial (dipole) frequencies found by the algorithm, and the coloured circles (triangles) indicate the pulsation modes of one model that agrees with the echelle diagram. Again, the echelle diagram is repeated to the right of the dashed black line for better visibility.
Current usage metrics show cumulative count of Article Views (full-text article views including HTML views, PDF and ePub downloads, according to the available data) and Abstracts Views on Vision4Press platform.
Data correspond to usage on the plateform after 2015. The current usage metrics is available 48-96 hours after online publication and is updated daily on week days.
Initial download of the metrics may take a while.