Fig. 3.

Download original image
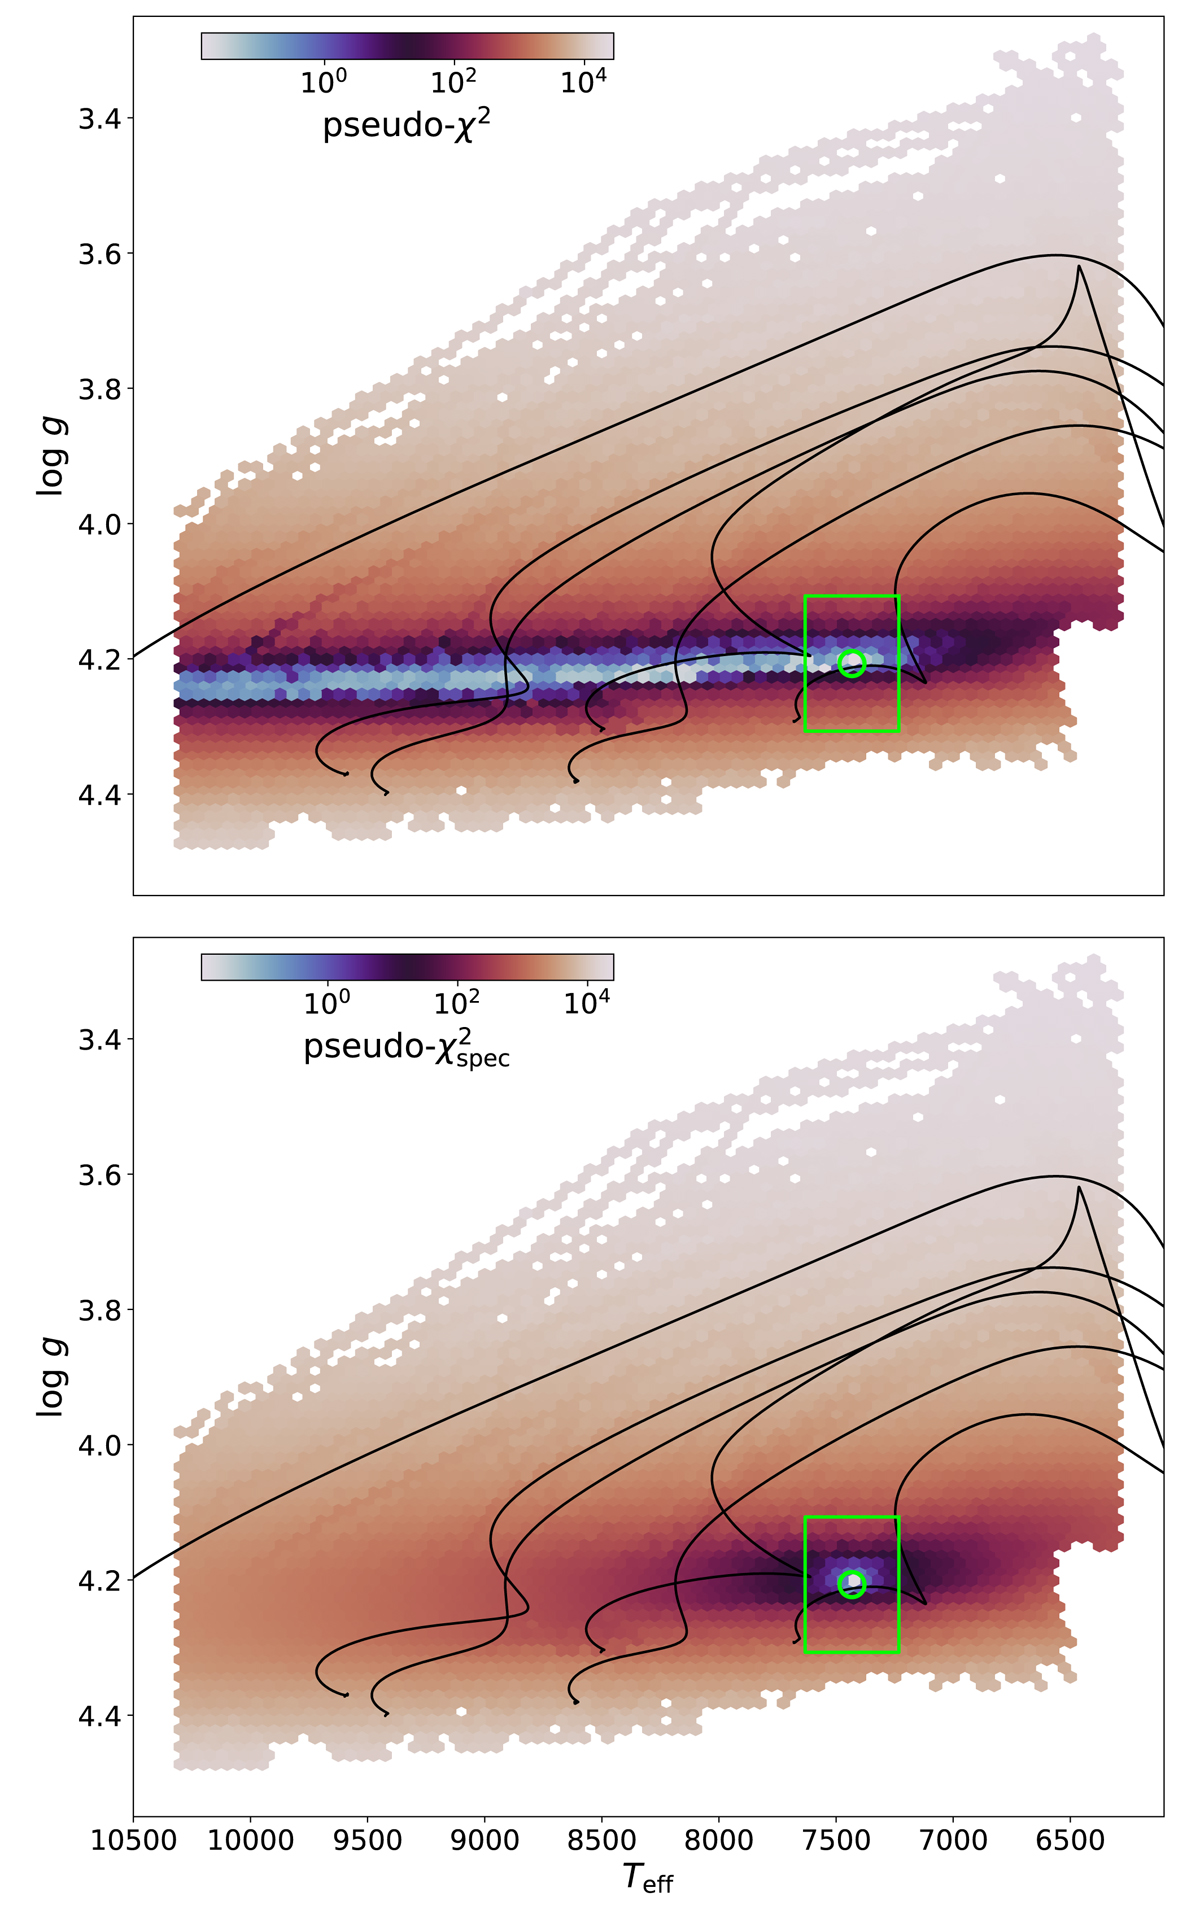
Hexbin plot of the resulting pseudo-χ2 statistic according to Eq. (6) (upper panel) and Eq. (7) (lower panel) for the theoretical model #10001 with a Rayleigh limit of ![]() d−1. The colours of the bins show the minimal value of all models that fall within the bin. Black lines show the same evolutionary tracks as in Fig. 1. The correct position of model #10001 is marked with the green circle and the assumed spectroscopic error box is drawn in green.
d−1. The colours of the bins show the minimal value of all models that fall within the bin. Black lines show the same evolutionary tracks as in Fig. 1. The correct position of model #10001 is marked with the green circle and the assumed spectroscopic error box is drawn in green.
Current usage metrics show cumulative count of Article Views (full-text article views including HTML views, PDF and ePub downloads, according to the available data) and Abstracts Views on Vision4Press platform.
Data correspond to usage on the plateform after 2015. The current usage metrics is available 48-96 hours after online publication and is updated daily on week days.
Initial download of the metrics may take a while.


