Open Access
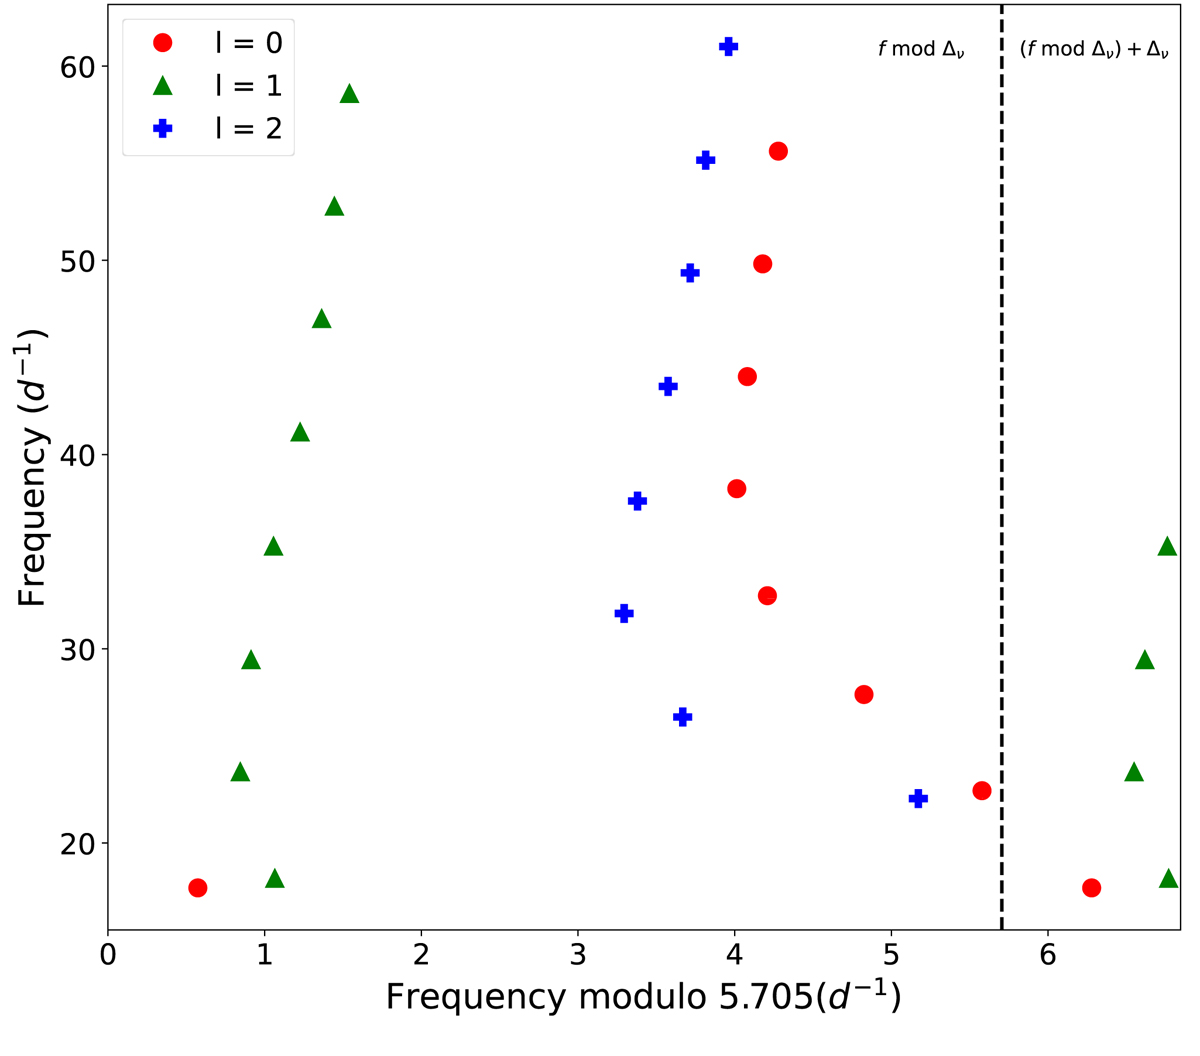
Fig. 2.
Download original image
Echelle diagram of theoretical model #10001. The red, green, and blue symbols correspond to the frequencies of the fundamental and first seven overtones for the radial, dipole, and quadrupole modes, respectively. The echelle diagram is repeated to the right of the dashed black line for better visibility.
Current usage metrics show cumulative count of Article Views (full-text article views including HTML views, PDF and ePub downloads, according to the available data) and Abstracts Views on Vision4Press platform.
Data correspond to usage on the plateform after 2015. The current usage metrics is available 48-96 hours after online publication and is updated daily on week days.
Initial download of the metrics may take a while.