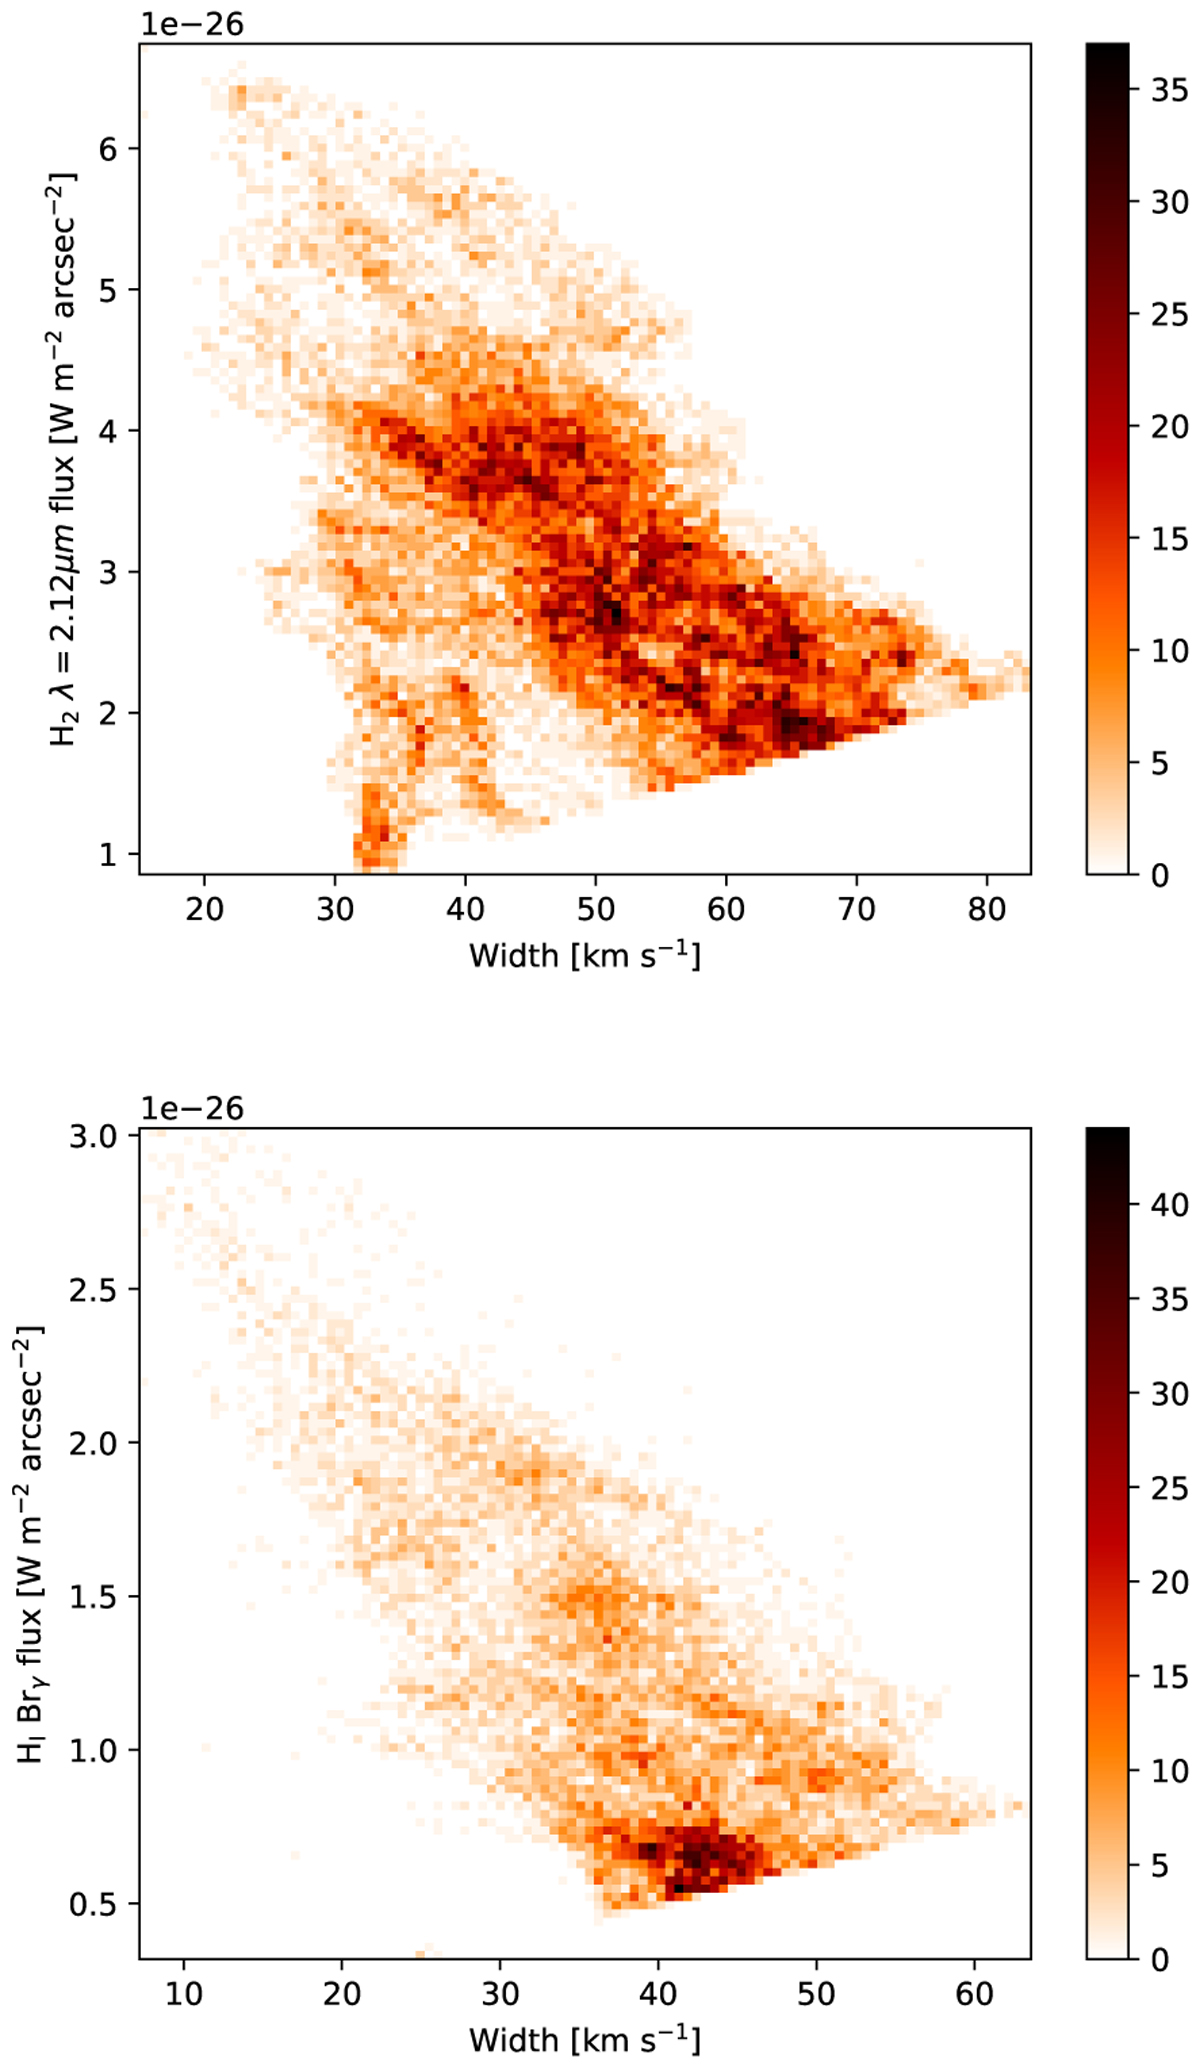
Fig. 6
Download original image
Line flux vs. width density plot (arbitrary units) in the NE mosaic. Top: H2 (λ = 2.12 µm). Bottom: H II. The threshold imposed on intensity results in a tilted lower selection boundary on this plot. For both species, the two quantities are anticorrelated. Although remarkable, the overall anticorrelation is not very tight. Denser regions in the plot could be the trace of individual clumps in the CND with a tighter local anticorrelation, modulated by variable foreground extinction.
Current usage metrics show cumulative count of Article Views (full-text article views including HTML views, PDF and ePub downloads, according to the available data) and Abstracts Views on Vision4Press platform.
Data correspond to usage on the plateform after 2015. The current usage metrics is available 48-96 hours after online publication and is updated daily on week days.
Initial download of the metrics may take a while.