Fig. 4
Download original image
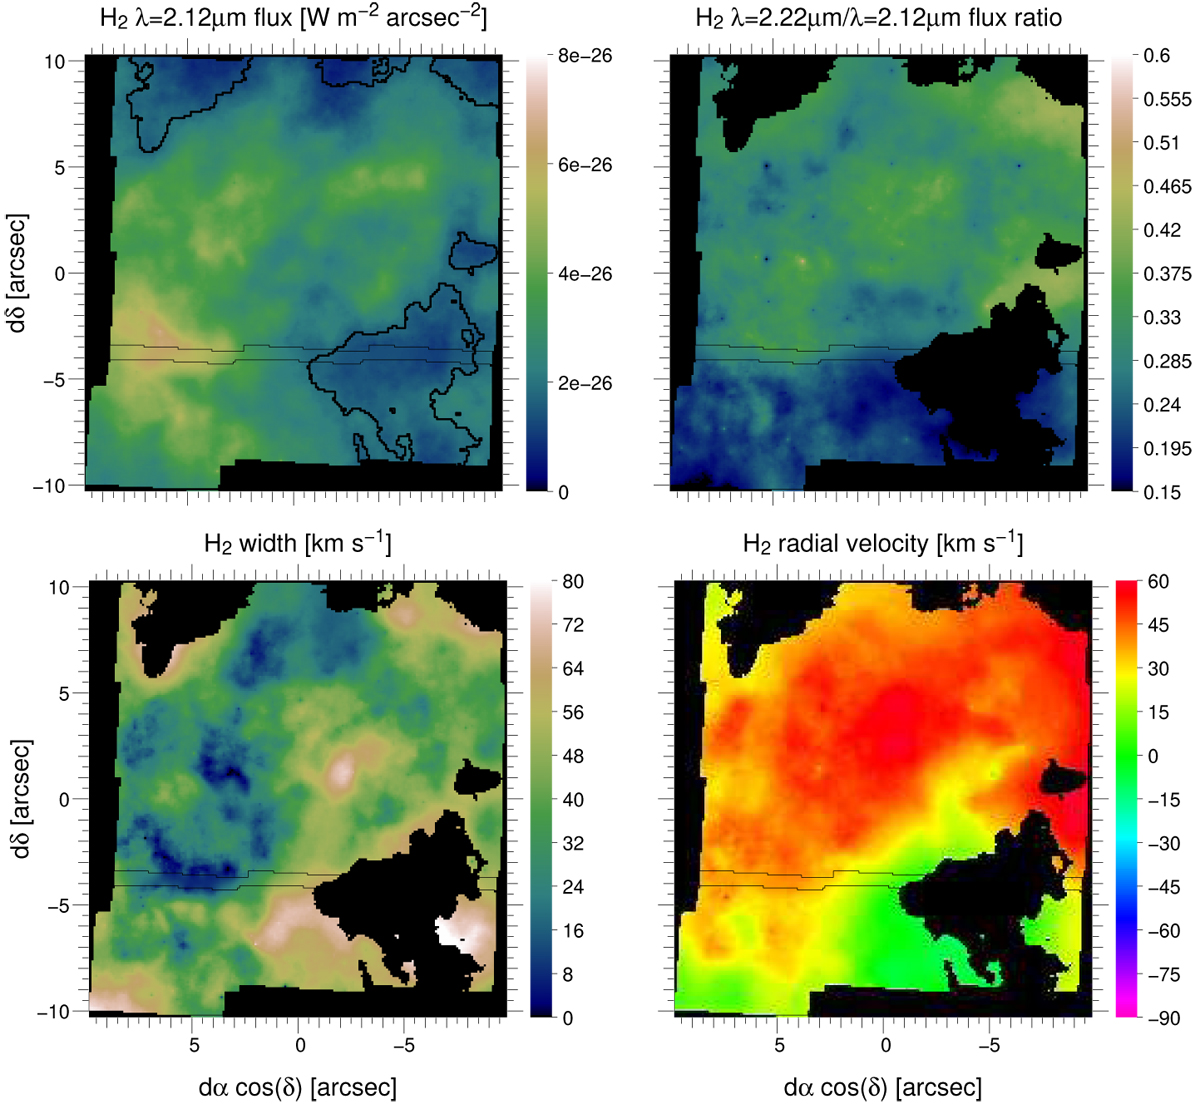
Result of CubeFit on the NE mosaic for both H2 lines. A black curve on the flux map delineates the amplitude threshold (see text). This region is masked out in the other maps. The four maps are, from top left to bottom right: H2 λ2.12 µm line flux ![]() , flux ratio between the two lines
, flux ratio between the two lines ![]() , common intrinsic linewidth
, common intrinsic linewidth ![]() , and common intrinsic radial velocity shift
, and common intrinsic radial velocity shift ![]() .
.
Current usage metrics show cumulative count of Article Views (full-text article views including HTML views, PDF and ePub downloads, according to the available data) and Abstracts Views on Vision4Press platform.
Data correspond to usage on the plateform after 2015. The current usage metrics is available 48-96 hours after online publication and is updated daily on week days.
Initial download of the metrics may take a while.