Fig. 3

Download original image
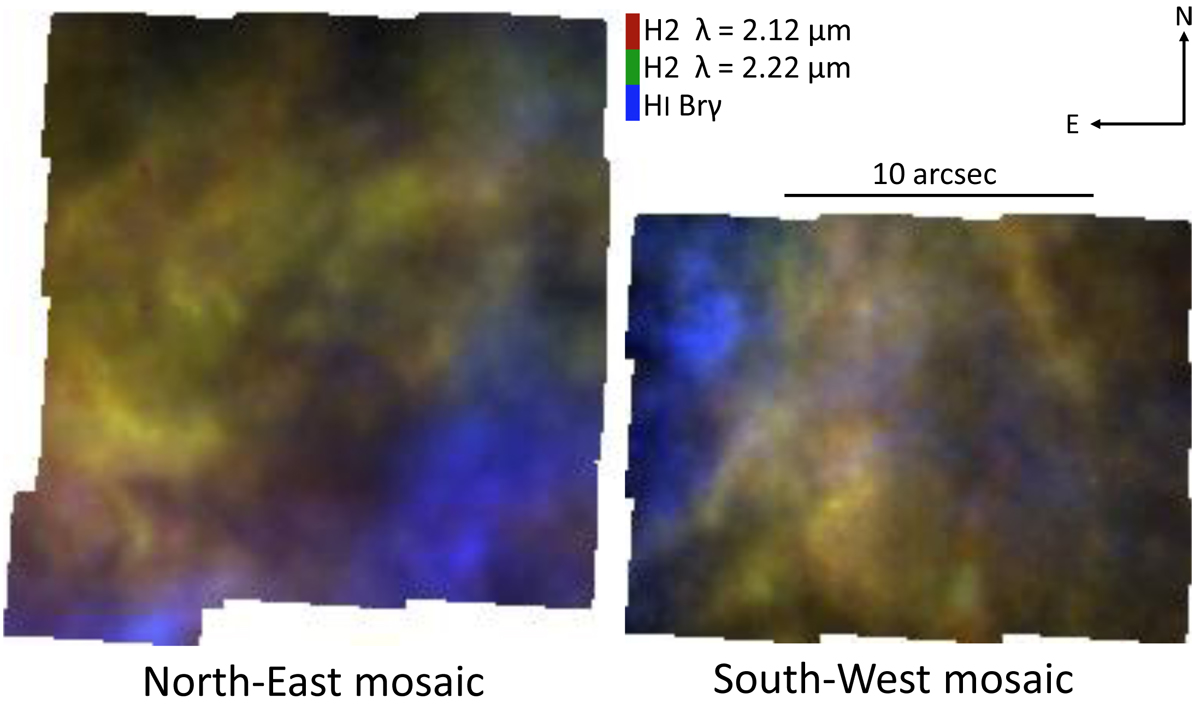
Composite line maps of the NE (left panel) and SW (right panel) mosaics. The flux of each of the three lines of interest has been assigned a color: red shows H2 (2.12 µm), green H2 (2.22 µm), and blue H II (traced by Brγ, 2.17 µm). Line flux is estimated by our fitting procedure. Regularization ensures that the maps are smooth and provides for extrapolation (in particular, there is no gap anymore between the two fields). It actually also provides some extrapolation, but we cut the field-of-view to the initial one (except for the gap).
Current usage metrics show cumulative count of Article Views (full-text article views including HTML views, PDF and ePub downloads, according to the available data) and Abstracts Views on Vision4Press platform.
Data correspond to usage on the plateform after 2015. The current usage metrics is available 48-96 hours after online publication and is updated daily on week days.
Initial download of the metrics may take a while.


