Fig. 2
Download original image
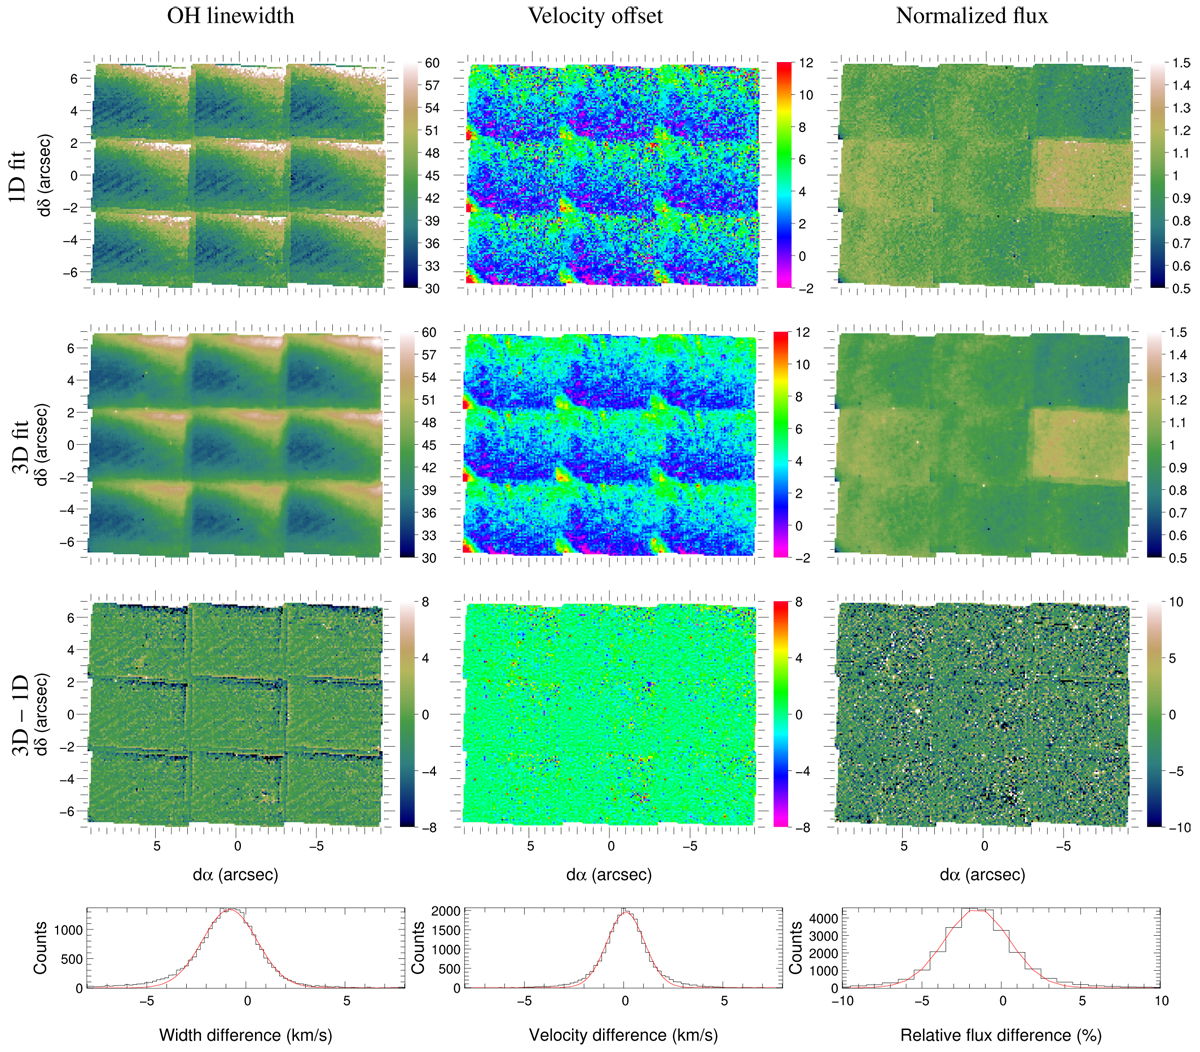
Results of multiple OH line fits for the SW mosaic. Left column: linewidth (km s−1). Center column: radial velocity offset (km s−1). Right column: flux of the brightest line estimated as intensity times width normalized to the 1D fit median. Top row: median-filtered parameter maps from the 1D fit. Second row from top: regularized maps from the 3D fit. Third row from top: 3D parameter maps minus 3D fit (divided by 1D fit for flux). Bottom row: histograms of difference maps (black histograms) and Gaussian fits to those histograms (red curves). The moments of the Gaussian fits to the histograms are: median µ = −0.82 km s−1 and width σ = 1.38 km s−1 for the linewidth difference; µ = 0.10 km s−1 and σ = 0.95 km s−1 for the line velocity difference; and µ = −1.5% and σ = 2.0% for the relative flux estimate difference.
Current usage metrics show cumulative count of Article Views (full-text article views including HTML views, PDF and ePub downloads, according to the available data) and Abstracts Views on Vision4Press platform.
Data correspond to usage on the plateform after 2015. The current usage metrics is available 48-96 hours after online publication and is updated daily on week days.
Initial download of the metrics may take a while.