Fig. A.1
Download original image
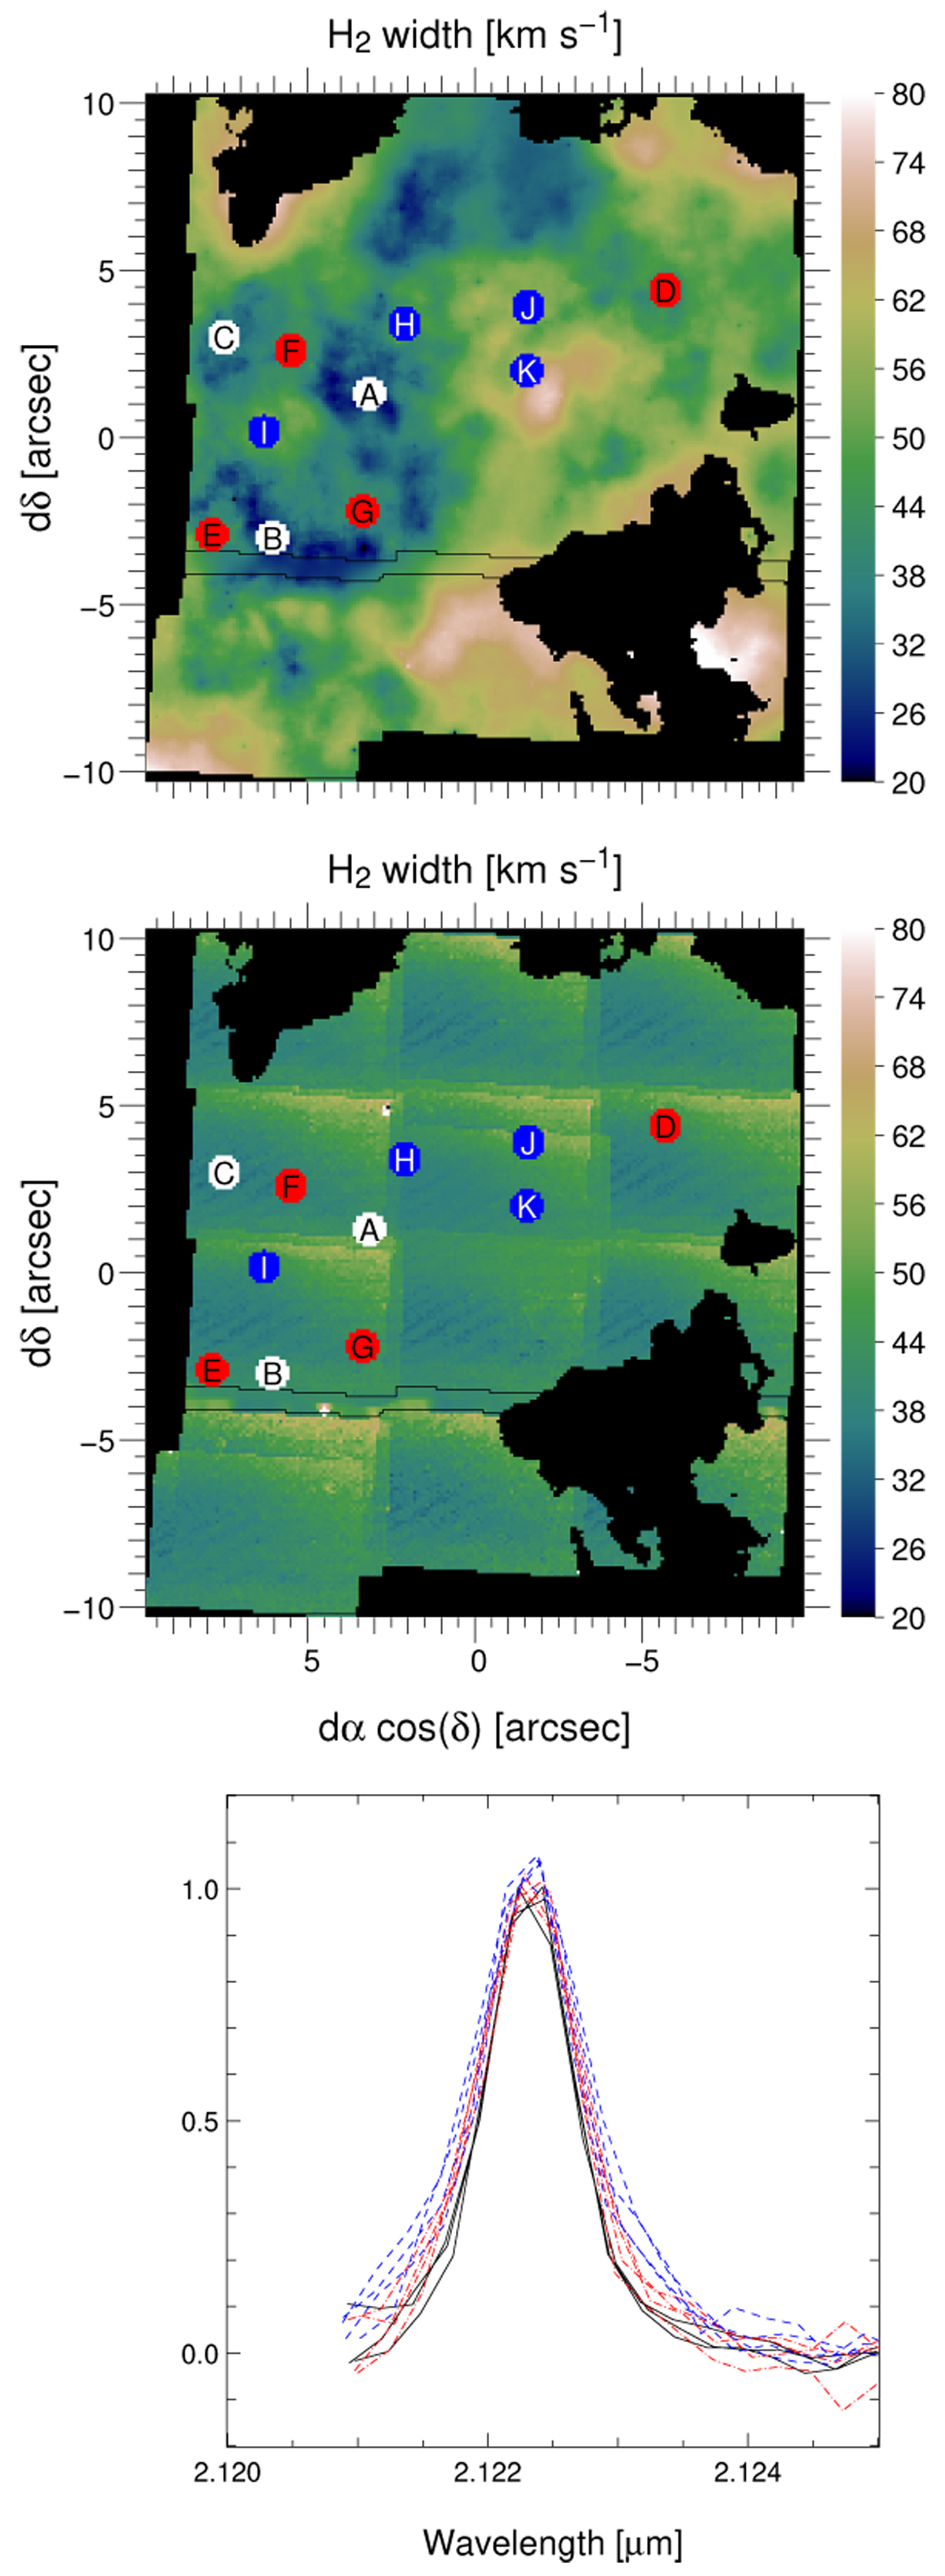
Variation in ![]() over the NE field. Top: H2 linewidth map (as in Fig. 4). The colored dots mark the aperture over which spectra have been extracted. Three distinct colors correspond to three linewidth ranges: < 35 km s−1 in white and black, 35–42 km s−1 in blue, and > 42 km s−1 in red. Middle: corresponding OH linewidth map. Bottom: spectra extracted over each aperture, normalized according to the 1D Gaussian fit. The black spectra correspond to the white apertures, and the red and blue spectra correspond to the red and blue apertures. The corresponding widths are listed in Table A.1.
over the NE field. Top: H2 linewidth map (as in Fig. 4). The colored dots mark the aperture over which spectra have been extracted. Three distinct colors correspond to three linewidth ranges: < 35 km s−1 in white and black, 35–42 km s−1 in blue, and > 42 km s−1 in red. Middle: corresponding OH linewidth map. Bottom: spectra extracted over each aperture, normalized according to the 1D Gaussian fit. The black spectra correspond to the white apertures, and the red and blue spectra correspond to the red and blue apertures. The corresponding widths are listed in Table A.1.
Current usage metrics show cumulative count of Article Views (full-text article views including HTML views, PDF and ePub downloads, according to the available data) and Abstracts Views on Vision4Press platform.
Data correspond to usage on the plateform after 2015. The current usage metrics is available 48-96 hours after online publication and is updated daily on week days.
Initial download of the metrics may take a while.