Fig. 13
Download original image
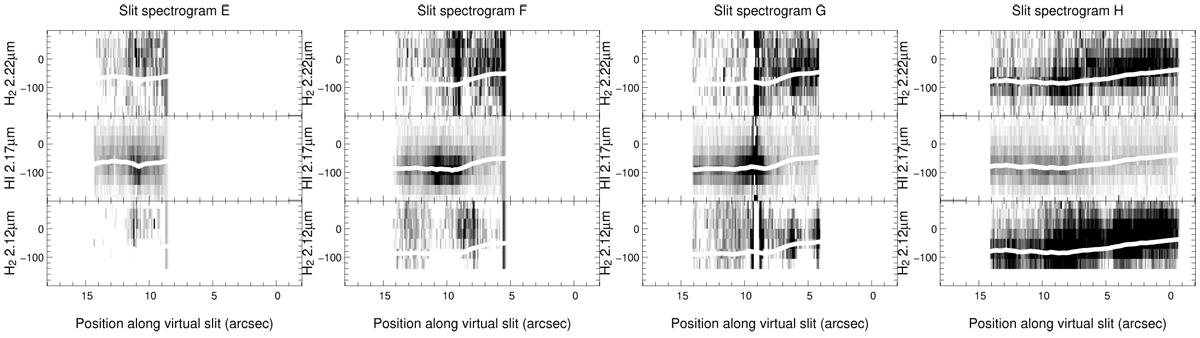
Slit-like spectrograms extracted from the SW mosaic data along the lines displayed in Fig. 9. The virtual slit has a width of 0.3 arcsec. Position-velocity images around each of the three spectral lines studied in this paper are displayed. The spectral axis is expressed as υLSR for each line. Overplotted is the H II radial velocity derived with CubeFit at the same location, and the curve is the same in each subpanel.
Current usage metrics show cumulative count of Article Views (full-text article views including HTML views, PDF and ePub downloads, according to the available data) and Abstracts Views on Vision4Press platform.
Data correspond to usage on the plateform after 2015. The current usage metrics is available 48-96 hours after online publication and is updated daily on week days.
Initial download of the metrics may take a while.