Fig. 11
Download original image
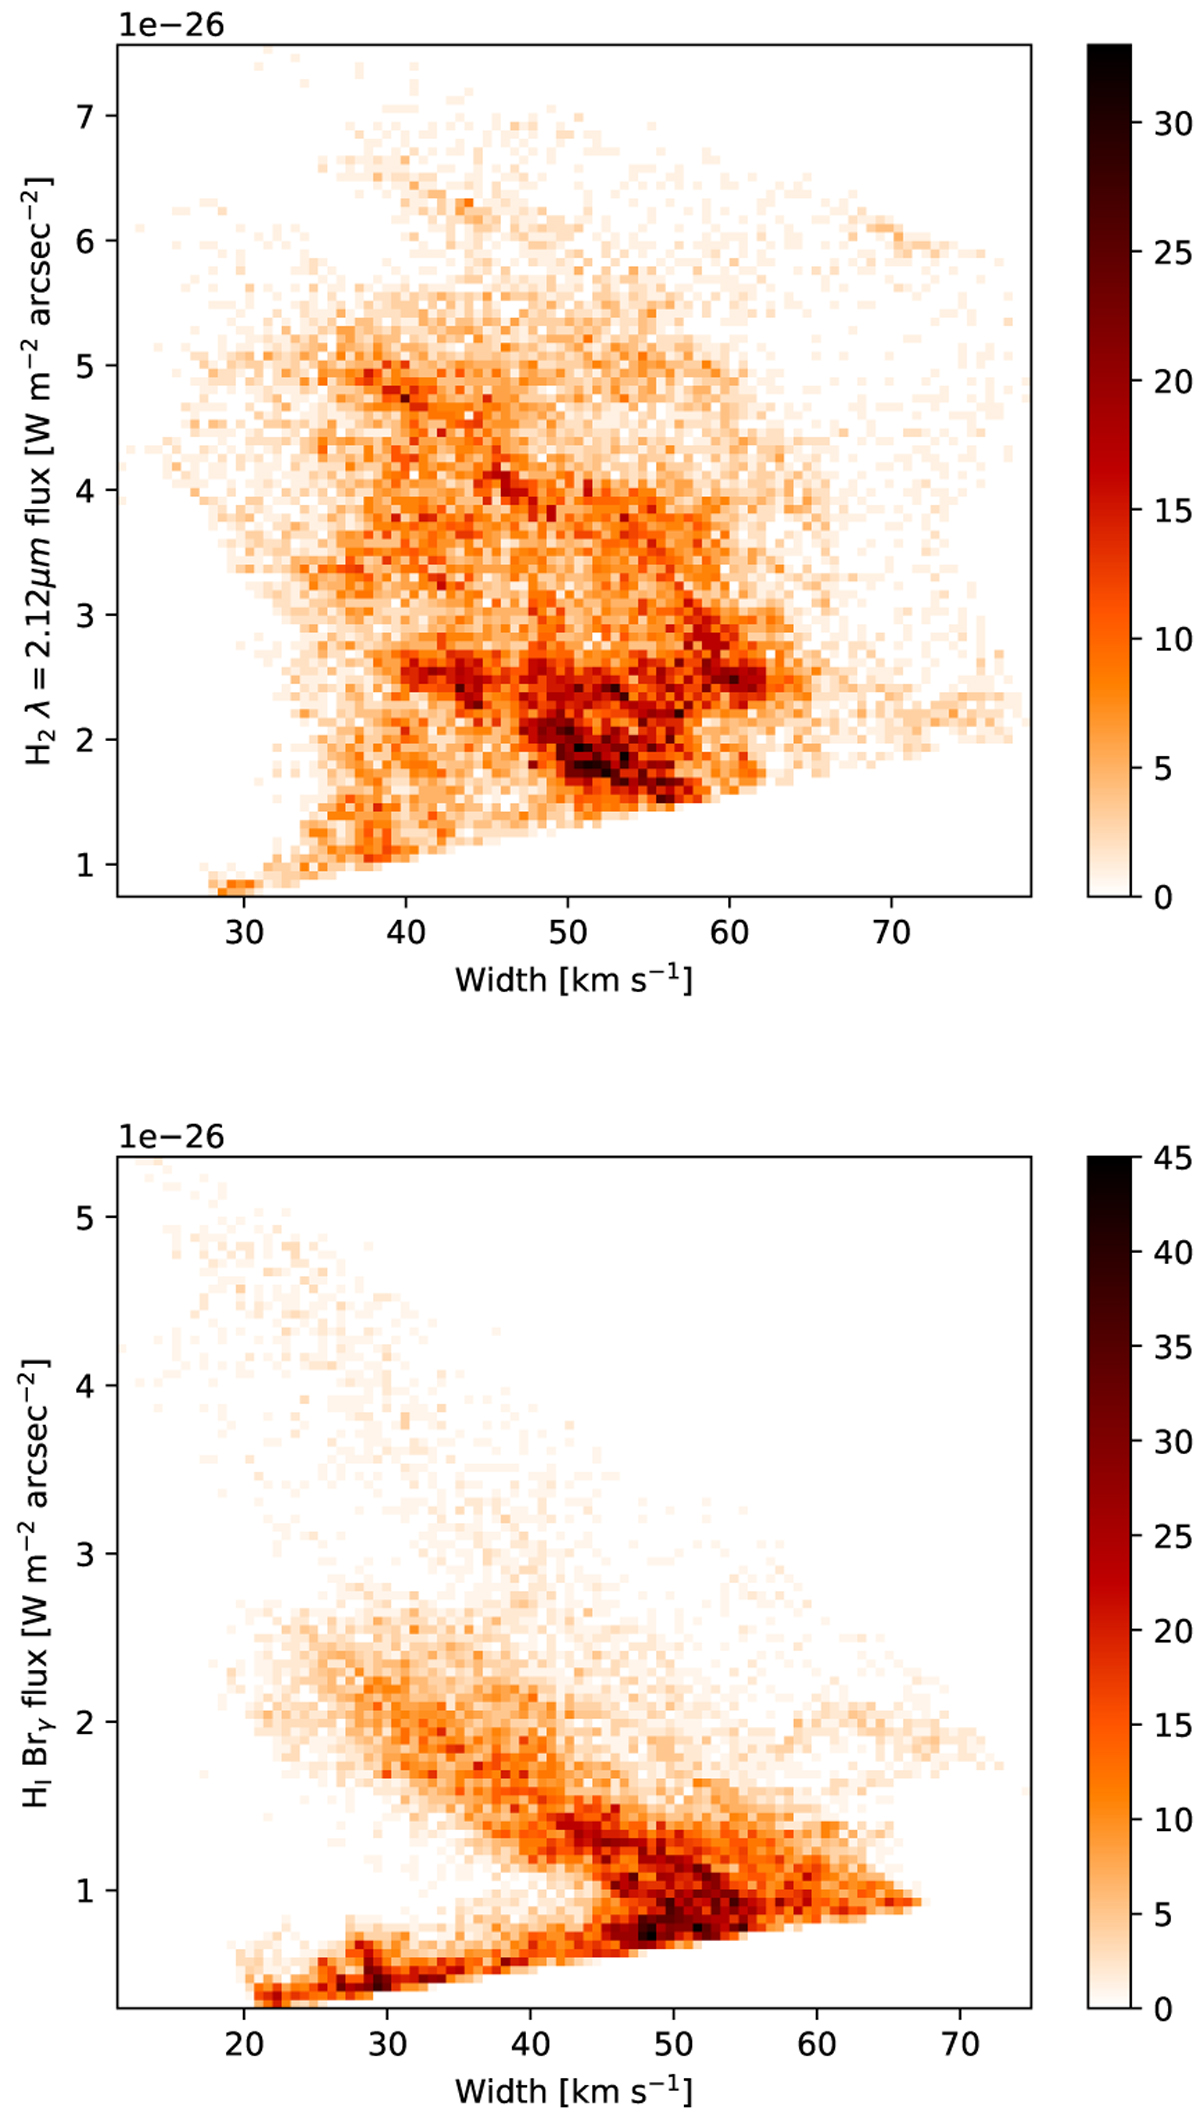
Line flux vs. width density plot (arbitrary units) in the SW mosaic (see Fig. 6). The anticorrelation between line flux and width is quite remarkable in the lower panel (Brγ), where it takes the form of several narrow, densely populated streaks on the density plot. In the top panel (H2), the anticorrelation is weaker than in the bottom panel and the density distribution is more diffuse, but one can still identify linear features, showing that such a correlation exists locally.
Current usage metrics show cumulative count of Article Views (full-text article views including HTML views, PDF and ePub downloads, according to the available data) and Abstracts Views on Vision4Press platform.
Data correspond to usage on the plateform after 2015. The current usage metrics is available 48-96 hours after online publication and is updated daily on week days.
Initial download of the metrics may take a while.