Open Access
Fig. 1
Download original image
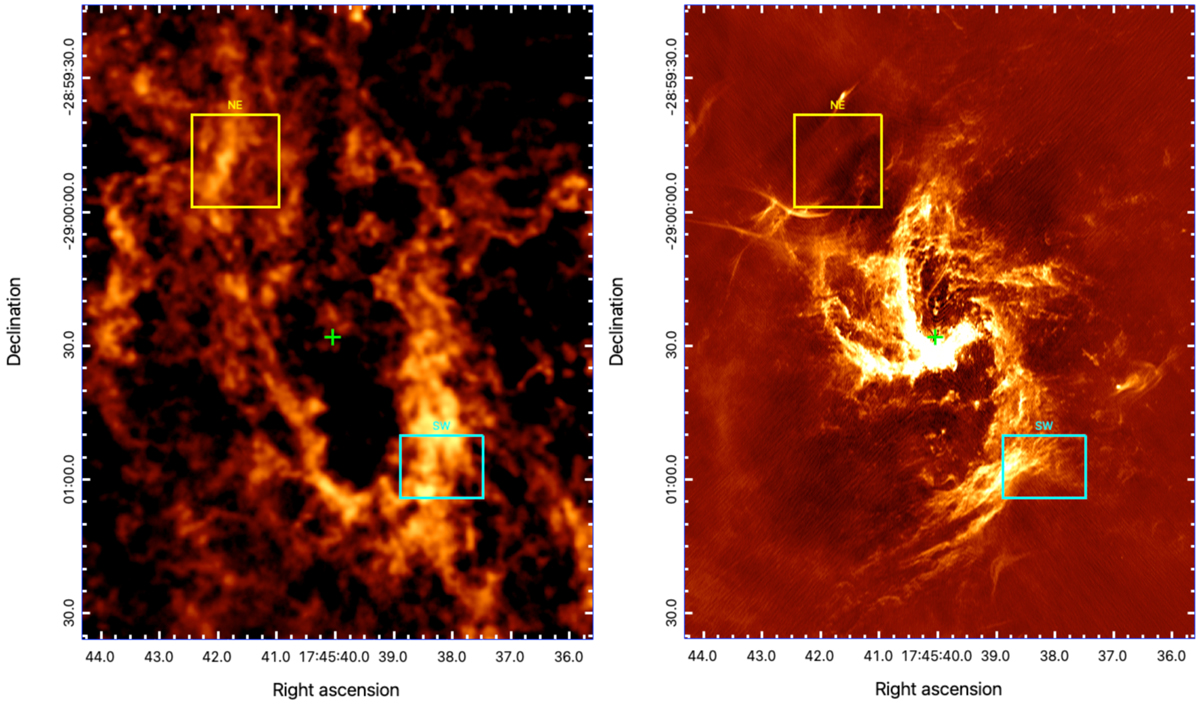
Outline of the two mosaicked regions reported here superimposed on: the total intensity map of J = 4−3 CS emission from ALMA (left; Hsieh et al. 2021), and the 6-cm radio continuum image from the VLA (right; Zhao et al. 2016; Morris et al. 2017). The location of Sgr A* is indicated in each panel with a green cross.
Current usage metrics show cumulative count of Article Views (full-text article views including HTML views, PDF and ePub downloads, according to the available data) and Abstracts Views on Vision4Press platform.
Data correspond to usage on the plateform after 2015. The current usage metrics is available 48-96 hours after online publication and is updated daily on week days.
Initial download of the metrics may take a while.