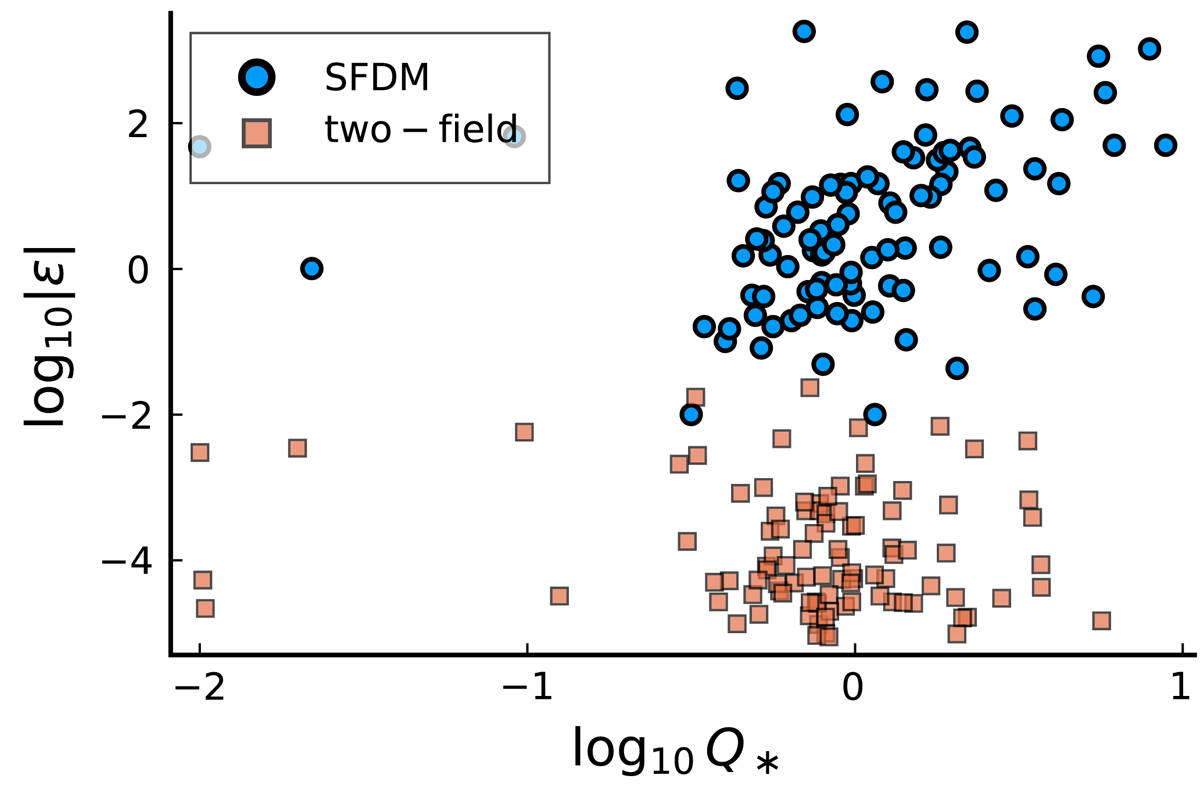
Fig. 3.
Download original image
Best-fit ε values versus the best-fit Q* values for the q = 1 galaxies. We show log10|ε| rather than log10|ε − εmin| to show how many galaxies end up in the MOND limit (corresponding to |ε*|≪1) rather than how many galaxies end up close to ρSF = 0 (corresponding to |ε* − εmin|≪1). For standard SFDM, the correlation coefficient is r = 0.28.
Current usage metrics show cumulative count of Article Views (full-text article views including HTML views, PDF and ePub downloads, according to the available data) and Abstracts Views on Vision4Press platform.
Data correspond to usage on the plateform after 2015. The current usage metrics is available 48-96 hours after online publication and is updated daily on week days.
Initial download of the metrics may take a while.