Open Access
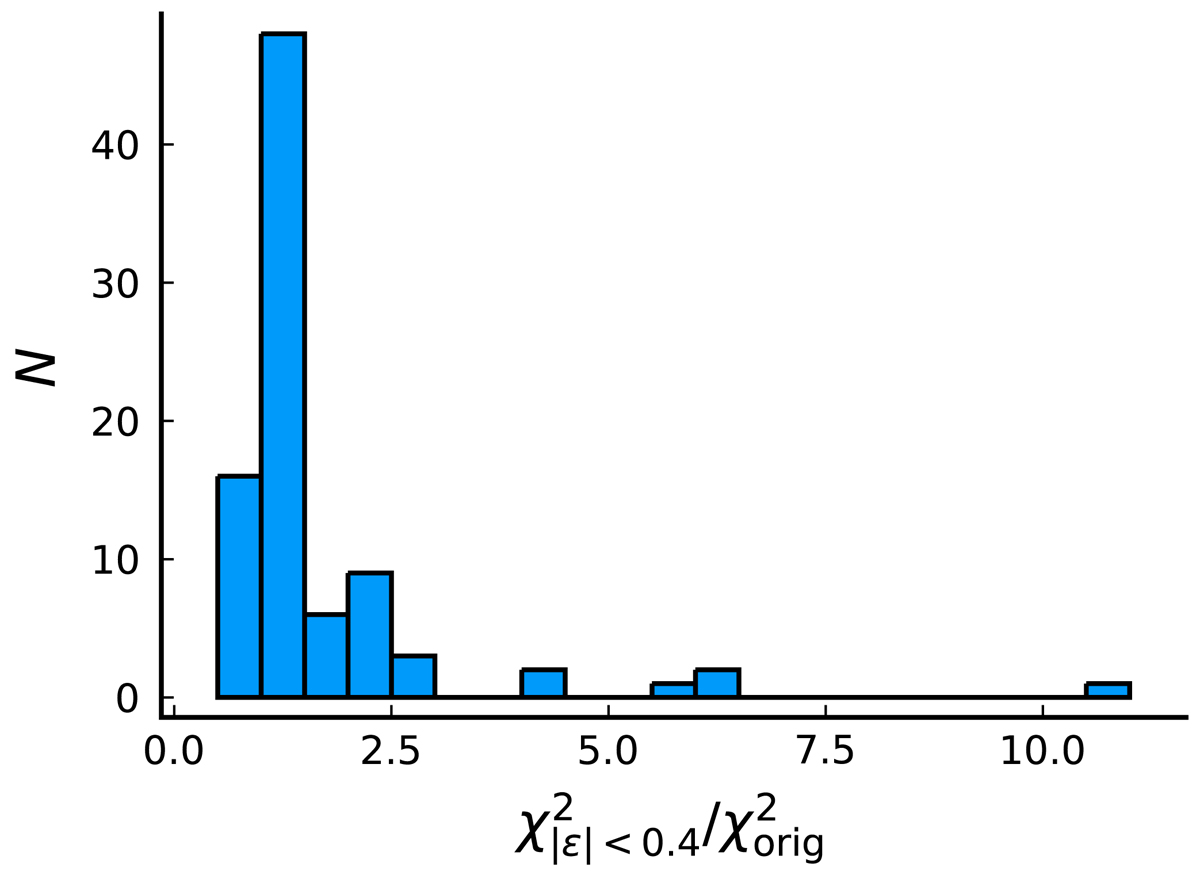
Fig. D.6.
Download original image
Histogram of the change in best-fit χ2 values for the q = 1 galaxies when switching from the unrestricted SFDM fit to that with the restriction |ε|< 0.4. This is excluding the galaxies that only barely satisfy |ε|< 0.4 and therefore have a bad χ2, i.e., excluding galaxies with ε > 0.38 and χ2 > 100.
Current usage metrics show cumulative count of Article Views (full-text article views including HTML views, PDF and ePub downloads, according to the available data) and Abstracts Views on Vision4Press platform.
Data correspond to usage on the plateform after 2015. The current usage metrics is available 48-96 hours after online publication and is updated daily on week days.
Initial download of the metrics may take a while.