Fig. 9
Download original image
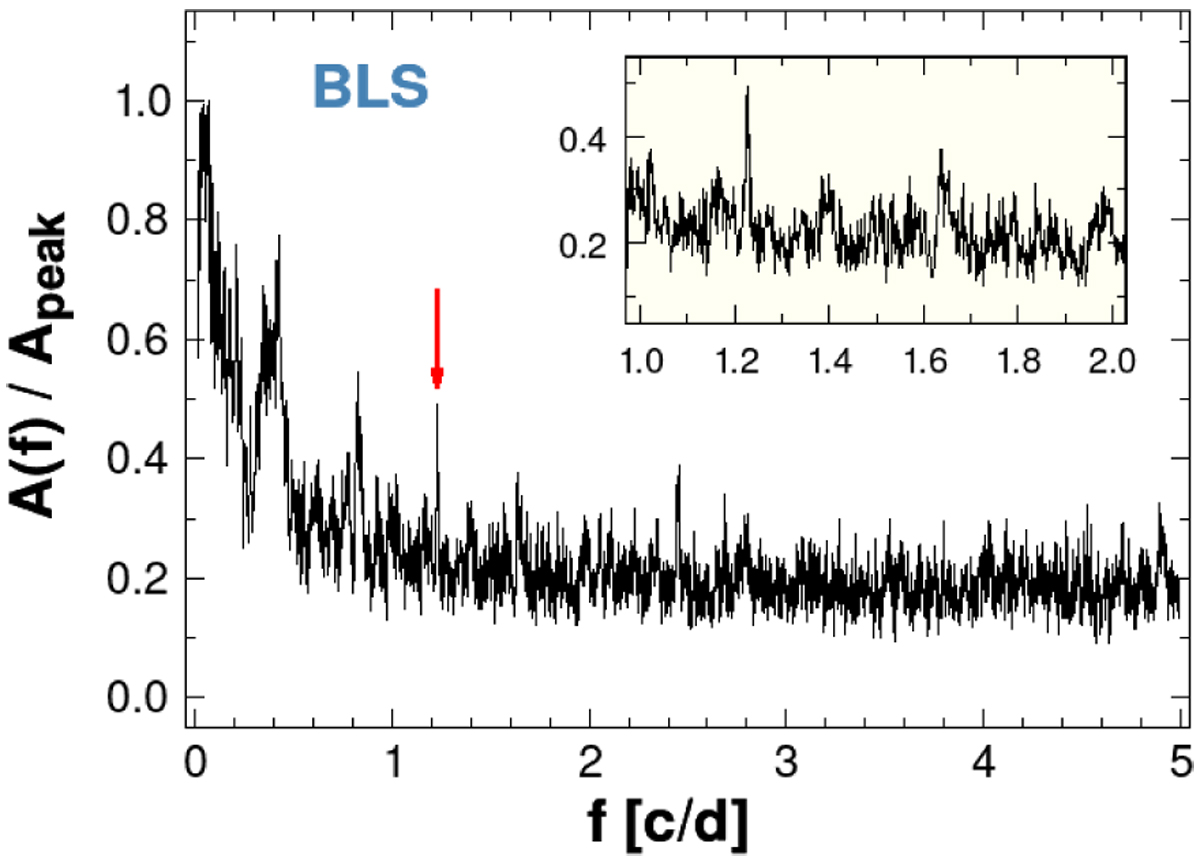
Injected transit test of the full TESS dataset. We used the SAP light curve to inject the signal and then robust polynomial filtering was employed to lower the red noise. We show the frequency spectrum of the time series derived in this way, after subtracting the transit signal of planet b. Red arrow indicates the peak due to the injected signal with a transit depth of 0.3 ppt. The inset shows the close neighborhood of the test signal.
Current usage metrics show cumulative count of Article Views (full-text article views including HTML views, PDF and ePub downloads, according to the available data) and Abstracts Views on Vision4Press platform.
Data correspond to usage on the plateform after 2015. The current usage metrics is available 48-96 hours after online publication and is updated daily on week days.
Initial download of the metrics may take a while.