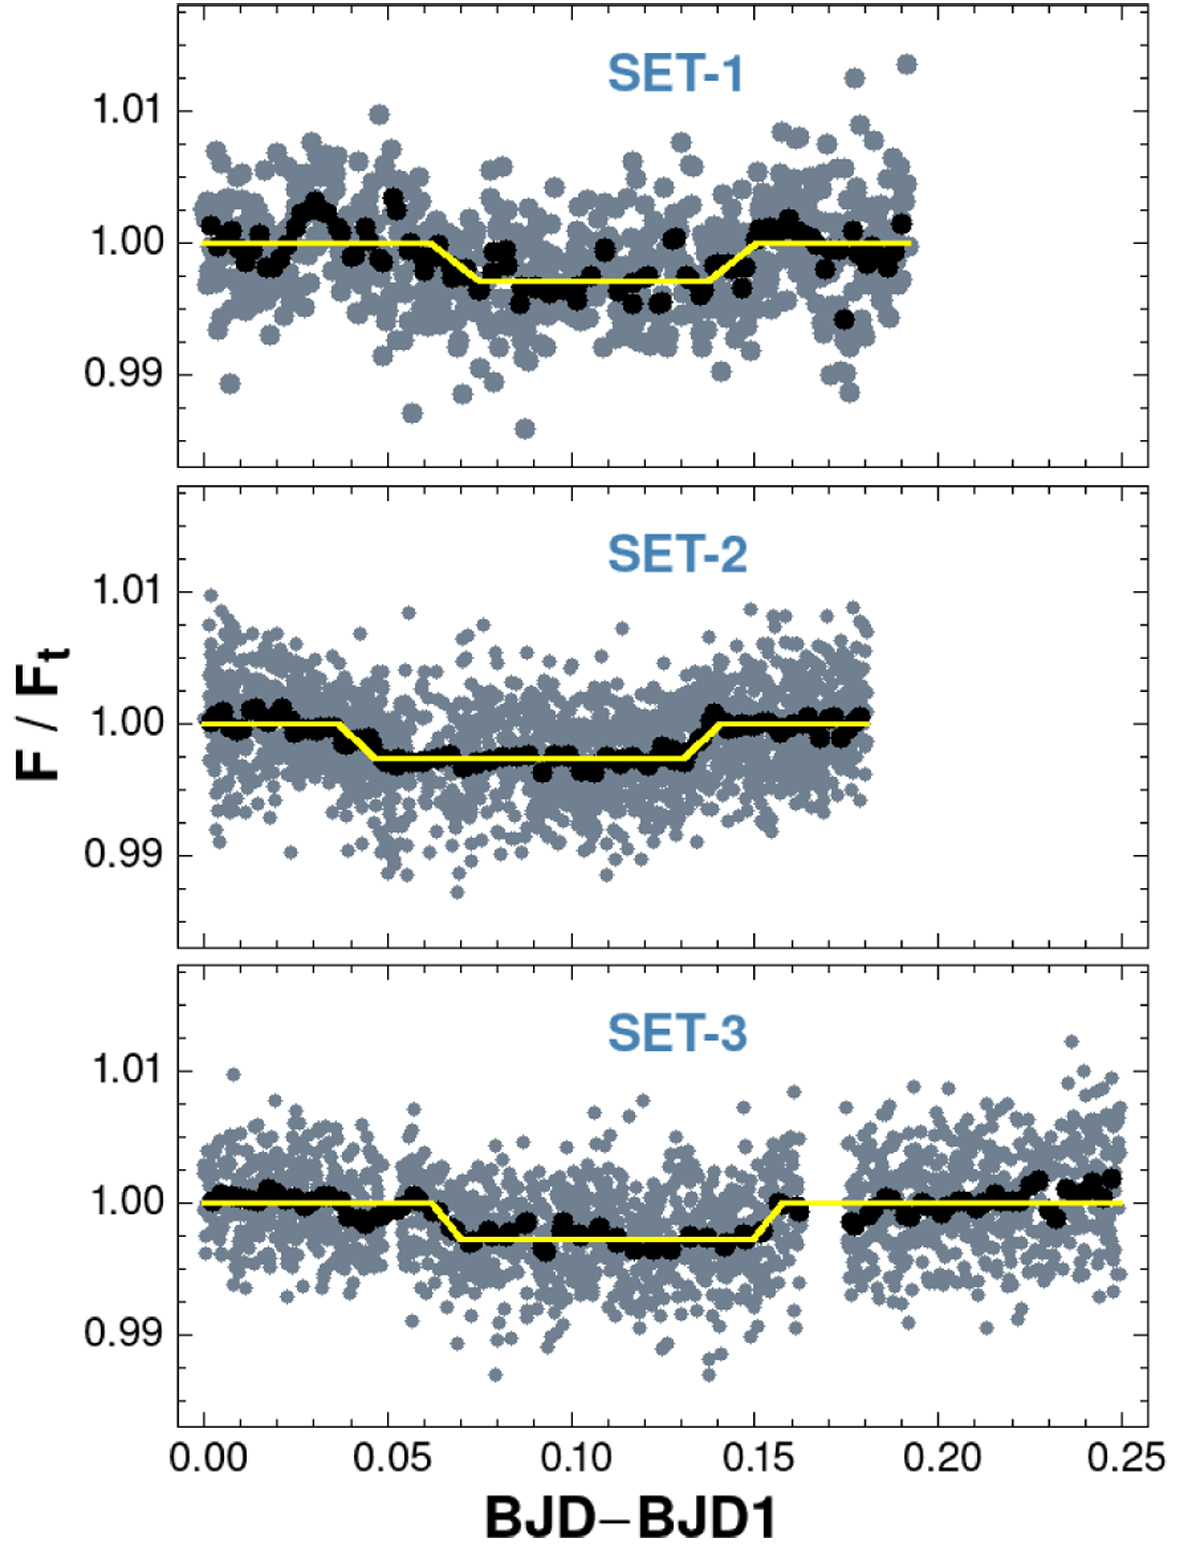
Fig. 4
Download original image
Three light curves of Table 1 in the pre-merging phase. All light curves are filtered out from time-dependent linear trends and are normalized by the total (star+planet) flux Ft. Black dots are the binned values and yellow lines are the trapezoidal models fitted to the original (unbinned) data shown by deep gray dots. For better visibility, we increased the point size for set-1.
Current usage metrics show cumulative count of Article Views (full-text article views including HTML views, PDF and ePub downloads, according to the available data) and Abstracts Views on Vision4Press platform.
Data correspond to usage on the plateform after 2015. The current usage metrics is available 48-96 hours after online publication and is updated daily on week days.
Initial download of the metrics may take a while.